Recycling rates vary widely around the world, but most developed countries recycle between 30% and 60% of household waste.
This page compiles the latest recycling statistics for the UK, the US and globally, including landfill use and e-waste trends.
Menu: Jump to a section
- Recycling Rates by Country
- What Can You Recycle?
- How Do You Recycle Electronic Devices?
- Landfill Waste Statistics
- Global Recycling Statistics
- US Recycling Statistics
- UK Recycling Statistics
- Europe Recycling Statistics
- Recycling by Age Group
- Global E-Waste Statistics
- Old Phones and E-Waste
- People Are Keeping Phones for Longer
- SellCell Predicts: Device Lifespan and E-Waste
- Sources
Key Recycling Facts (2026)
- E-waste generation reached 62 million tonnes globally in 2022 (Global E-waste Monitor)
- Just 22.3% of global e-waste is formally recycled (Global E-waste Monitor)
- 77.7% of e-waste is not formally recycled (Global E-waste Monitor)
- By 2030, global e-waste could reach 82 million tonnes (Global E-waste Monitor)
- Total global waste is projected to reach 3.8 billion tonnes annually by 2050 (World Bank)
- The world generates 2.01 billion tonnes of municipal waste each year (World Bank)
- E-waste is growing 5x faster than recycling efforts (ITU)
- Global e-waste is increasing by around 2.6 million tonnes per year (Global E-waste Monitor)
- $62 billion worth of materials is lost annually through e-waste (Global E-waste Monitor)
- On average, each person generates 7.8kg of e-waste globally (ITU)
- Household recycling rates in the UK sit at 44% (Defra / gov.uk)
- US recycling rate: 32% (EPA)
- Germany recycling rate: 68.7% (Eurostat)
- Landfill rates range from 1% to over 80% of municipal waste across Europe (EEA)
- SellCell’s Electronics Hoarding Survey shows 78.6% of UK consumers keep unused smartphones at home (SellCell research)
- 299 million unused devices in UK homes (SellCell research)
Recycling Rates by Country
Recycling rates vary significantly by country, based on the share of waste that is recycled:
- United Kingdom: 44% of household waste recycled (Defra / gov.uk)
- United States: 32% of municipal waste recycled and composted (EPA)
- EU average: 47.7% of municipal waste recycled (Eurostat)
- Germany: 68.7% of municipal waste recycled (Eurostat)
- South Korea: 67.1% of municipal waste recycled (OECD)
- Bulgaria: 16.7% of municipal waste recycled (Eurostat)
- Cyprus: 16.0% of municipal waste recycled (Eurostat)
- Romania: 12.4% of municipal waste recycled (Eurostat)
- Greece: 81% of municipal waste sent to landfill (EEA)
- Germany: 1% of municipal waste sent to landfill (EEA)
What Can You Recycle?
Most household recycling schemes accept the following materials:
- Paper and cardboard
- Glass bottles and jars
- Metal cans and tins
- Plastic bottles and containers
Many areas also provide separate collection points for batteries and small electronics.
How Do You Recycle Electronic Devices?
Old phones and electronics should not be placed in general waste.
SellCell’s Electronics Hoarding Survey shows that 78.6% of UK consumers and 76.3% of US consumers keep unused devices at home.
Many councils offer electrical recycling points, whilst trade-in services like SellCell allow users to compare resale offers and keep devices in circulation for longer. In some areas, in-store kiosks and collection schemes are also available.
If a device still works, selling or reusing it can extend its life.
Readers can compare resale offers using our cell phone recycling guide.
Landfill Waste Statistics
Landfill sites are still a major destination for waste globally.
The World Bank estimates that 2.01 billion tonnes of municipal solid waste are generated globally each year, with landfill still a major disposal method in many countries. (World Bank)
One of the world’s largest landfill sites is Apex Regional Landfill near Las Vegas, which covers 2,200 acres. (Guinness World Records)
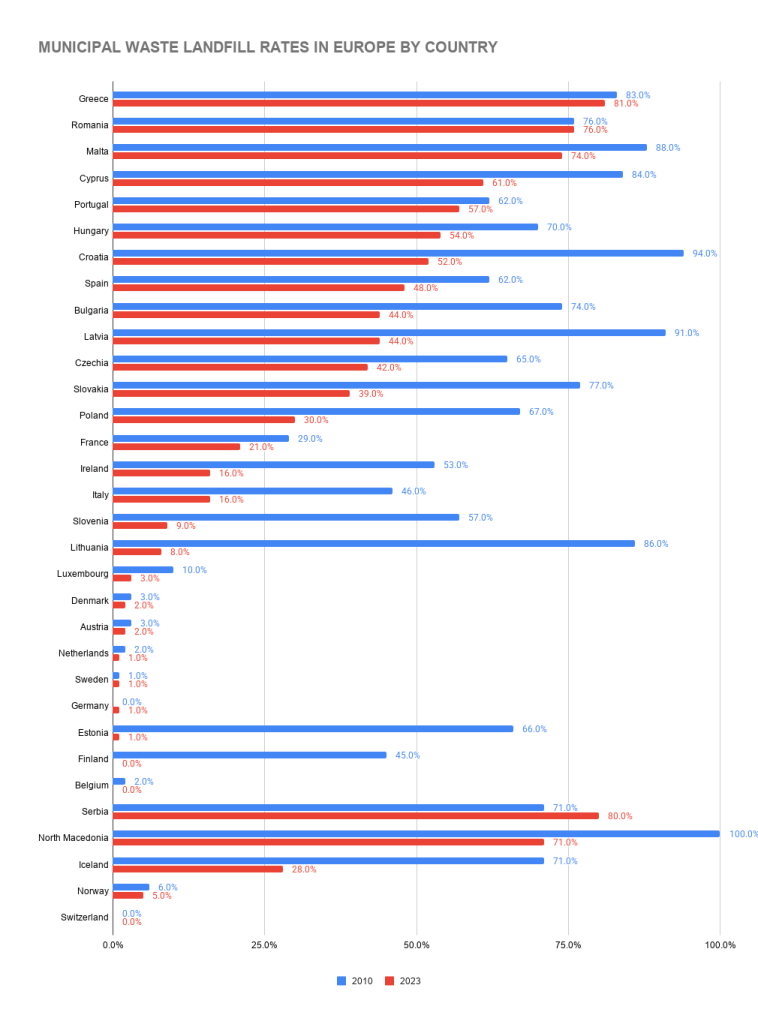
| MUNICIPAL WASTE LANDFILL RATES IN EUROPE BY COUNTRY | ||
|---|---|---|
| 2010 | 2023 | |
| Greece | 83.0% | 81.0% |
| Romania | 76.0% | 76.0% |
| Malta | 88.0% | 74.0% |
| Cyprus | 84.0% | 61.0% |
| Portugal | 62.0% | 57.0% |
| Hungary | 70.0% | 54.0% |
| Croatia | 94.0% | 52.0% |
| Spain | 62.0% | 48.0% |
| Bulgaria | 74.0% | 44.0% |
| Latvia | 91.0% | 44.0% |
| Czechia | 65.0% | 42.0% |
| Slovakia | 77.0% | 39.0% |
| Poland | 67.0% | 30.0% |
| France | 29.0% | 21.0% |
| Ireland | 53.0% | 16.0% |
| Italy | 46.0% | 16.0% |
| Slovenia | 57.0% | 9.0% |
| Lithuania | 86.0% | 8.0% |
| Luxembourg | 10.0% | 3.0% |
| Denmark | 3.0% | 2.0% |
| Austria | 3.0% | 2.0% |
| Netherlands | 2.0% | 1.0% |
| Sweden | 1.0% | 1.0% |
| Germany | 0.0% | 1.0% |
| Estonia | 66.0% | 1.0% |
| Finland | 45.0% | 0.0% |
| Belgium | 2.0% | 0.0% |
| Serbia | 71.0% | 80.0% |
| North Macedonia | 100.0% | 71.0% |
| Iceland | 71.0% | 28.0% |
| Norway | 6.0% | 5.0% |
| Switzerland | 0.0% | 0.0% |
- Greece remains one of Europe’s most landfill-reliant countries, with 81% of municipal waste going to landfill.
- Romania sends 76% of municipal waste to landfill, while Malta remains above 70%.
- Germany, Belgium and Switzerland send close to 0% of municipal waste to landfill.
- Italy and France have reduced landfill use significantly, now sitting at 16% and 21% respectively.
- Across much of Europe, the long-term trend has been away from landfill and towards recycling or energy recovery.
How Many People Recycle in the World?
There is no single global recycling rate, but national data shows large differences between countries, with some recycling over 60% of waste while others still rely heavily on landfill.
Global Municipal Waste and Recycling
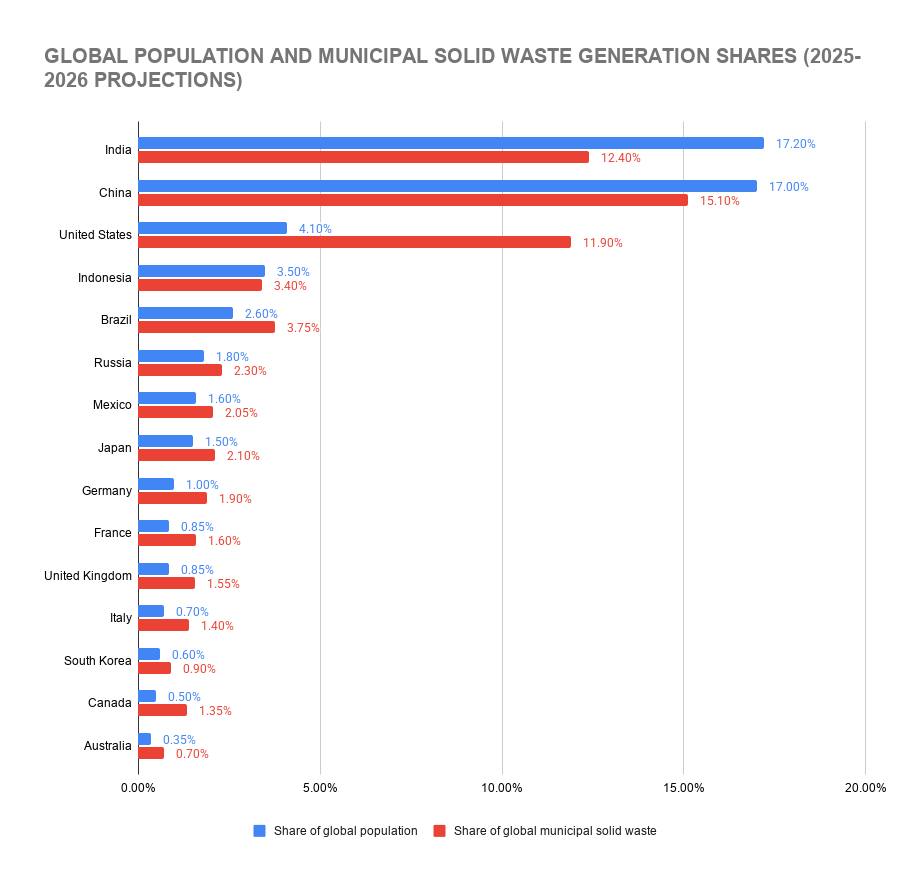
| GLOBAL POPULATION AND MUNICIPAL SOLID WASTE GENERATION SHARES (2025-2026 PROJECTIONS) | ||
|---|---|---|
| Share of global population | Share of global municipal solid waste | |
| India | 17.20% | 12.40% |
| China | 17.00% | 15.10% |
| United States | 4.10% | 11.90% |
| Indonesia | 3.50% | 3.40% |
| Brazil | 2.60% | 3.75% |
| Russia | 1.80% | 2.30% |
| Mexico | 1.60% | 2.05% |
| Japan | 1.50% | 2.10% |
| Germany | 1.00% | 1.90% |
| France | 0.85% | 1.60% |
| United Kingdom | 0.85% | 1.55% |
| Italy | 0.70% | 1.40% |
| South Korea | 0.60% | 0.90% |
| Canada | 0.50% | 1.35% |
| Australia | 0.35% | 0.70% |
- China accounts for 15.1% of global municipal waste in this comparison, with India close behind at 12.4%.
- The United States produces 11.9% of global municipal waste, despite having only about 4.1% of the world’s population.
- Canada and Australia also generate a higher share of global municipal waste than their population size alone would suggest.
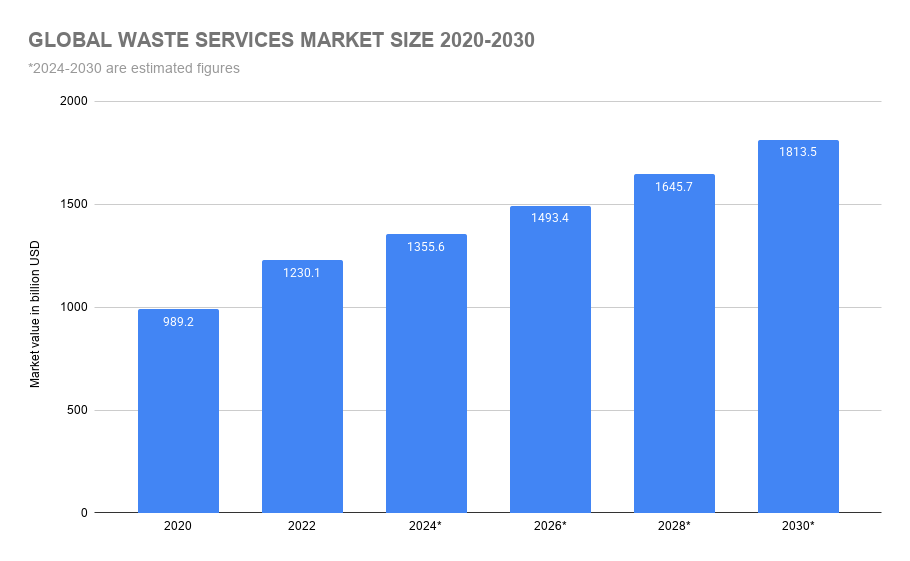
| GLOBAL WASTE SERVICES MARKET SIZE 2020-2030 | |
|---|---|
| Market value in billion USD | |
| 2020 | 989.2 |
| 2022 | 1230.1 |
| 2024* | 1355.6 |
| 2026* | 1493.4 |
| 2028* | 1645.7 |
| 2030* | 1813.5 |
| *2024-2030 are estimated figures | |
- The global waste management market was worth $1.23 trillion in 2022.
- Forecasts suggest it could reach $1.81 trillion by 2030.
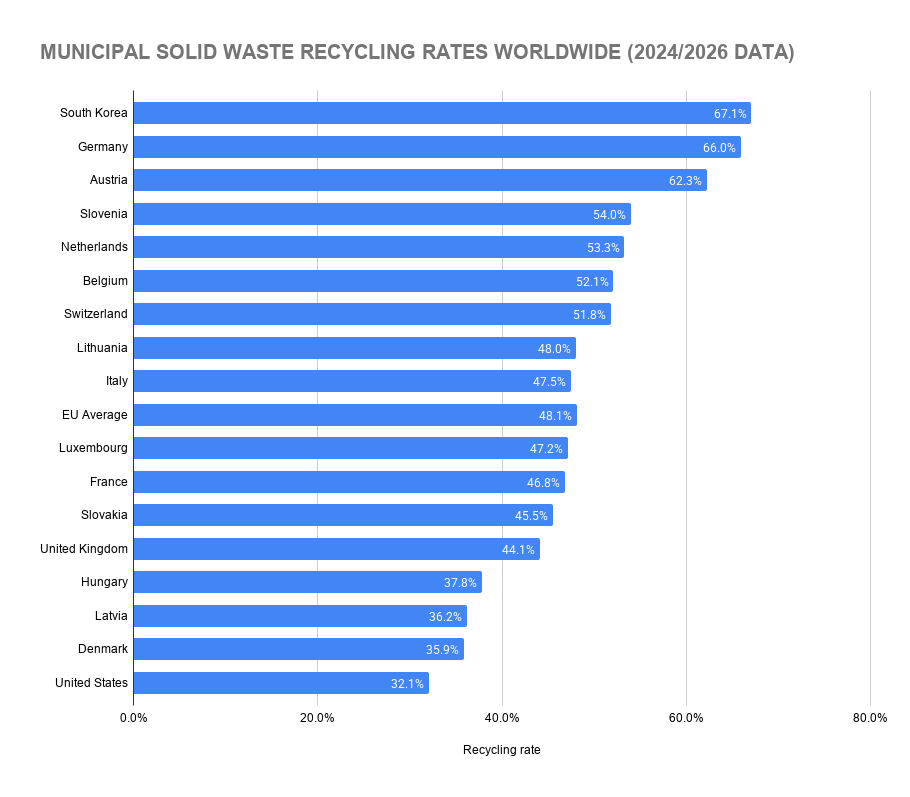
| MUNICIPAL SOLID WASTE RECYCLING RATES WORLDWIDE (2024/2026 DATA) | |
|---|---|
| Recycling rate | |
| South Korea | 67.1% |
| Germany | 66.0% |
| Austria | 62.3% |
| Slovenia | 54.0% |
| Netherlands | 53.3% |
| Belgium | 52.1% |
| Switzerland | 51.8% |
| Lithuania | 48.0% |
| Italy | 47.5% |
| EU Average | 48.1% |
| Luxembourg | 47.2% |
| France | 46.8% |
| Slovakia | 45.5% |
| United Kingdom | 44.1% |
| Hungary | 37.8% |
| Latvia | 36.2% |
| Denmark | 35.9% |
| United States | 32.1% |
- South Korea (67.1%) and Germany (66.0%) have the highest municipal waste recycling rates.
- Austria recycles 62.3% of municipal waste, while several European countries also exceed 50%.
- The UK recycles 44.1% of municipal waste, compared with 32.1% in the United States.
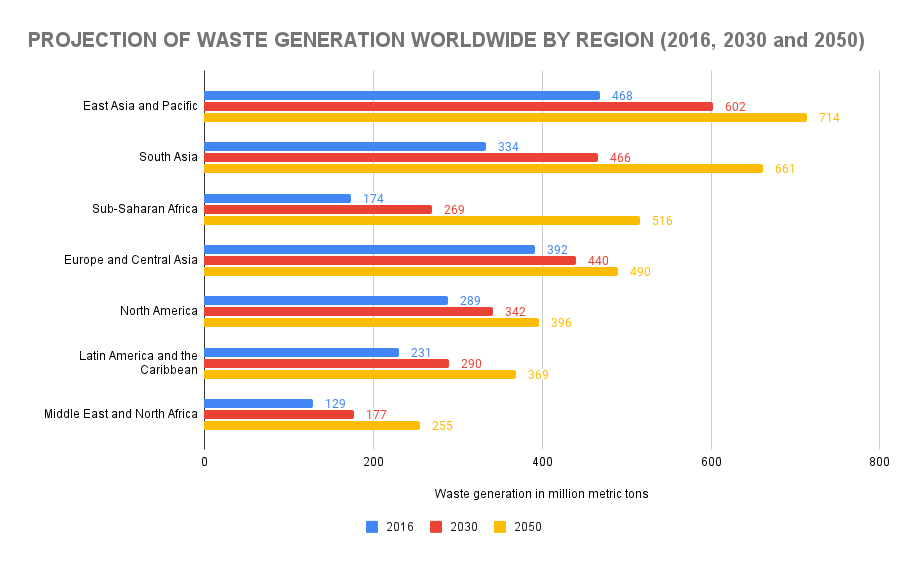
| PROJECTION OF WASTE GENERATION WORLDWIDE BY REGION (2016, 2030 and 2050) | |||
|---|---|---|---|
| 2016 | 2030 | 2050 | |
| East Asia and Pacific | 468 | 602 | 714 |
| South Asia | 334 | 466 | 661 |
| Sub-Saharan Africa | 174 | 269 | 516 |
| Europe and Central Asia | 392 | 440 | 490 |
| North America | 289 | 342 | 396 |
| Latin America and the Caribbean | 231 | 290 | 369 |
| Middle East and North Africa | 129 | 177 | 255 |
| *Figures above are million metric tons | |||
- East Asia and the Pacific are projected to rise from 468 million tonnes in 2016 to 714 million tonnes by 2050.
- South Asia is expected to grow from 334 million tonnes to 661 million tonnes over the same period.
- According to projections by World Bank, global waste volumes will reach 3.8 billion tonnes a year by 2050.
US Municipal Waste
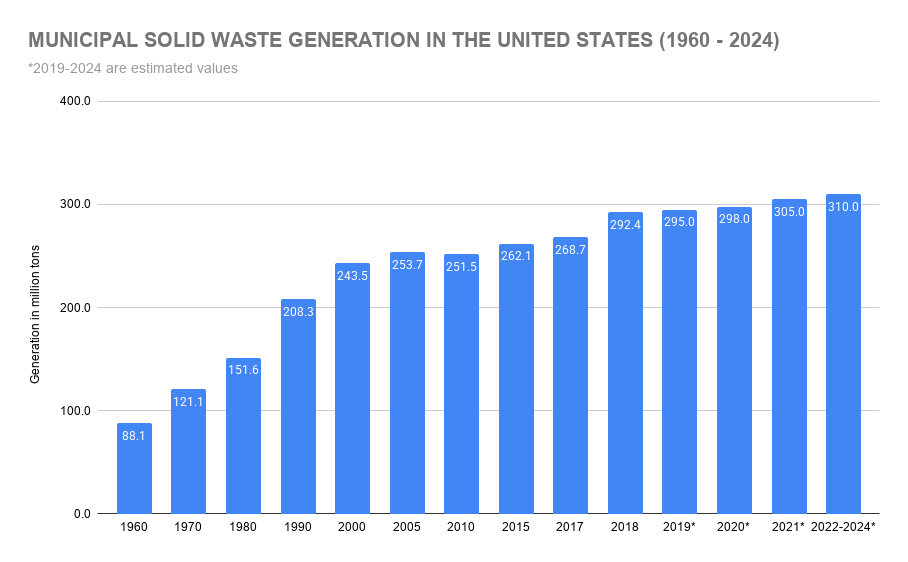
| MUNICIPAL SOLID WASTE GENERATION IN THE UNITED STATES (1960 – 2024) | |
|---|---|
| Generation in million tons | |
| 1960 | 88.1 |
| 1970 | 121.1 |
| 1980 | 151.6 |
| 1990 | 208.3 |
| 2000 | 243.5 |
| 2005 | 253.7 |
| 2010 | 251.5 |
| 2015 | 262.1 |
| 2017 | 268.7 |
| 2018 | 292.4 |
| 2019* | 295.0 |
| 2020* | 298.0 |
| 2021* | 305.0 |
| 2022-2024* | 310.0 |
| *2019-2024 are estimated values | |
- US waste generation has increased from 88.1 million tons in 1960 to 310 million tons in the latest estimates.
- Most of that increase happened over earlier decades, with growth slowing more recently.
- EPA reporting appears to lag, so newer figures look to be estimates.
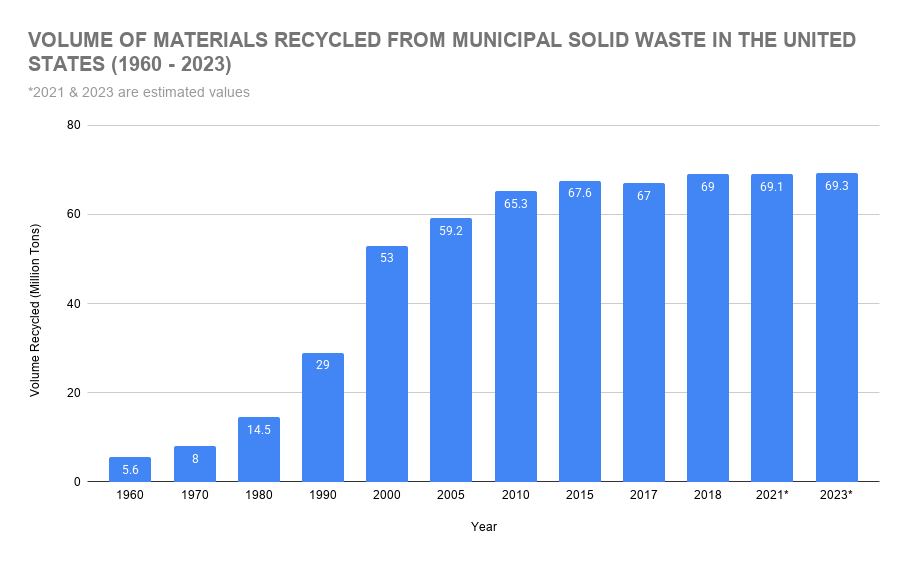
| VOLUME OF MATERIALS RECYCLED FROM MSW IN THE UNITED STATES FROM 1960 TO 2023 | |
|---|---|
| Volume of waste recycled in million tons | |
| 1960 | 5.6 |
| 1970 | 8.0 |
| 1980 | 14.5 |
| 1990 | 29.0 |
| 2000 | 53.0 |
| 2005 | 59.2 |
| 2010 | 65.3 |
| 2015 | 67.6 |
| 2017 | 67.0 |
| 2018 | 69.0 |
| 2021* | 69.1 |
| 2023* | 69.3 |
| *2021 & 2023 are estimated values | |
- Recycling volumes increased from 5.6 million tons in 1960 to 69 million tons.
- Growth was strongest between 1980 and 2010, then largely flattened out.
- The US now recycles and composts 32% of household waste.
UK Municipal Waste
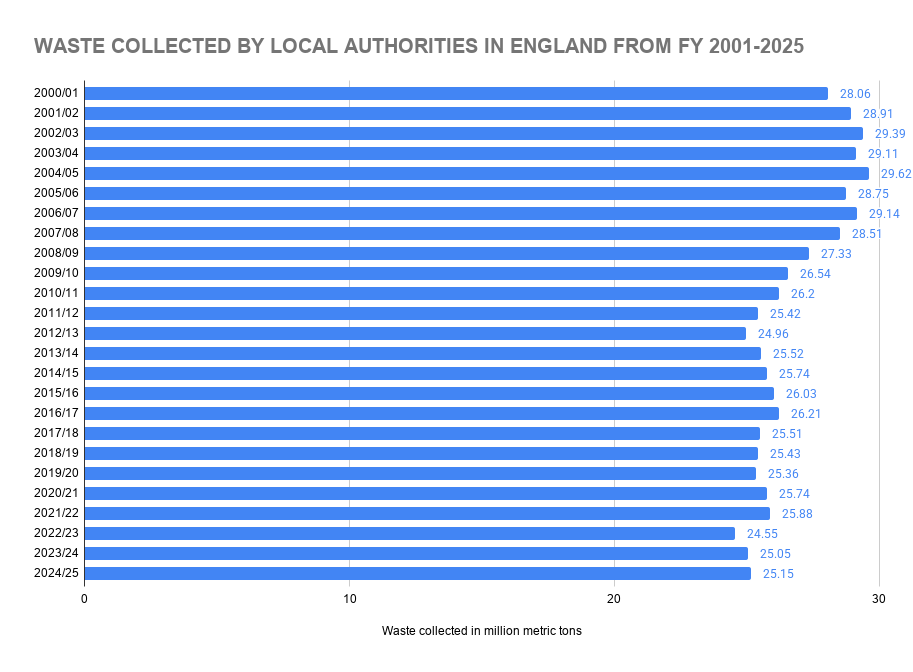
| WASTE COLLECTED BY LOCAL AUTHORITIES IN ENGLAND FROM FY 2001-2025 | |
|---|---|
| Waste collected in million metric tons | |
| 2000/01 | 28.06 |
| 2001/02 | 28.91 |
| 2002/03 | 29.39 |
| 2003/04 | 29.11 |
| 2004/05 | 29.62 |
| 2005/06 | 28.75 |
| 2006/07 | 29.14 |
| 2007/08 | 28.51 |
| 2008/09 | 27.33 |
| 2009/10 | 26.54 |
| 2010/11 | 26.2 |
| 2011/12 | 25.42 |
| 2012/13 | 24.96 |
| 2013/14 | 25.52 |
| 2014/15 | 25.74 |
| 2015/16 | 26.03 |
| 2016/17 | 26.21 |
| 2017/18 | 25.51 |
| 2018/19 | 25.43 |
| 2019/20 | 25.36 |
| 2020/21 | 25.74 |
| 2021/22 | 25.88 |
| 2022/23 | 24.55 |
| 2023/24 | 25.05 |
| 2024/25 | 25.15 |
- Waste collected by local authorities in England has stayed fairly stable in recent years.
- The dip in 2022/23 likely reflects a return to more normal levels after higher household waste volumes during the pandemic.
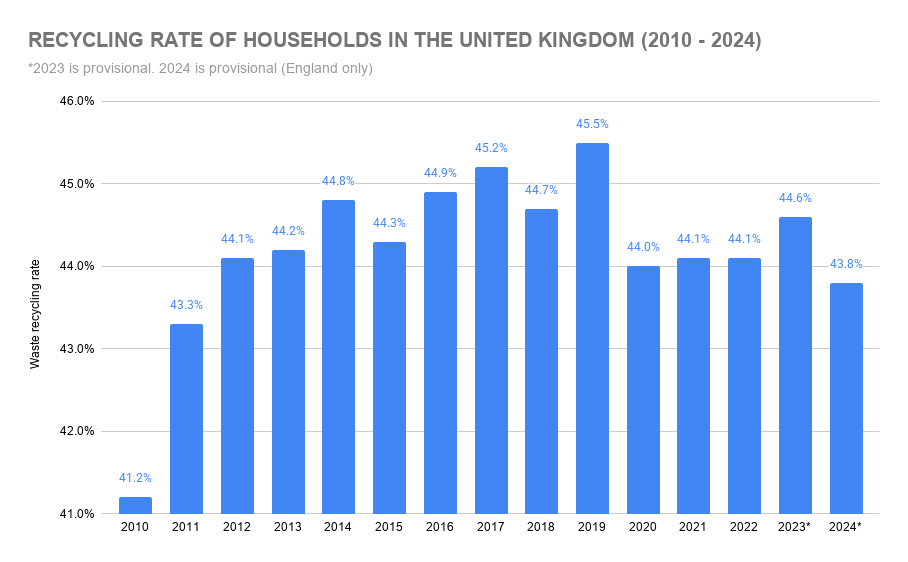
| RECYCLING RATE OF HOUSEHOLDS IN THE UNITED KINGDOM (2010 – 2024) | |
|---|---|
| Waste recycling rate | |
| 2010 | 41.2% |
| 2011 | 43.3% |
| 2012 | 44.1% |
| 2013 | 44.2% |
| 2014 | 44.8% |
| 2015 | 44.3% |
| 2016 | 44.9% |
| 2017 | 45.2% |
| 2018 | 44.7% |
| 2019 | 45.5% |
| 2020 | 44.0% |
| 2021 | 44.1% |
| 2022 | 44.1% |
| 2023* | 44.6% |
| 2024* | 43.8% |
| *2023 is provisional. 2024 is provisional (England only) | |
- UK household recycling rates have remained at 44% in recent years, with the latest rolling rate for England at 43.7%. (Defra / gov.uk)
Europe Municipal Waste
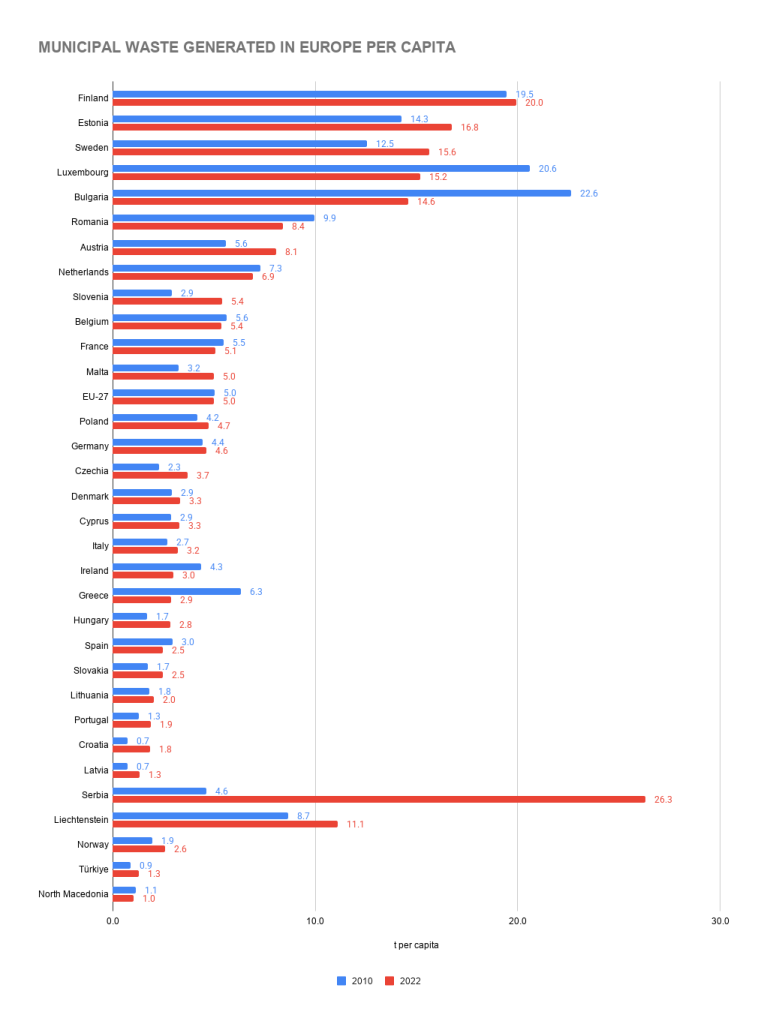
| MUNICIPAL WASTE GENERATED IN EUROPE PER CAPITA | ||
|---|---|---|
| Country | 2010 | 2022 |
| Finland | 19.5 | 20.0 |
| Estonia | 14.3 | 16.8 |
| Sweden | 12.5 | 15.6 |
| Luxembourg | 20.6 | 15.2 |
| Bulgaria | 22.6 | 14.6 |
| Romania | 9.9 | 8.4 |
| Austria | 5.6 | 8.1 |
| Netherlands | 7.3 | 6.9 |
| Slovenia | 2.9 | 5.4 |
| Belgium | 5.6 | 5.4 |
| France | 5.5 | 5.1 |
| Malta | 3.2 | 5.0 |
| EU-27 | 5.0 | 5.0 |
| Poland | 4.2 | 4.7 |
| Germany | 4.4 | 4.6 |
| Czechia | 2.3 | 3.7 |
| Denmark | 2.9 | 3.3 |
| Cyprus | 2.9 | 3.3 |
| Italy | 2.7 | 3.2 |
| Ireland | 4.3 | 3.0 |
| Greece | 6.3 | 2.9 |
| Hungary | 1.7 | 2.8 |
| Spain | 3.0 | 2.5 |
| Slovakia | 1.7 | 2.5 |
| Lithuania | 1.8 | 2.0 |
| Portugal | 1.3 | 1.9 |
| Croatia | 0.7 | 1.8 |
| Latvia | 0.7 | 1.3 |
| Serbia | 4.6 | 26.3 |
| Liechtenstein | 8.7 | 11.1 |
| Norway | 1.9 | 2.6 |
| Türkiye | 0.9 | 1.3 |
| North Macedonia | 1.1 | 1.0 |
- Finland records the highest municipal waste per capita at 20.0 tonnes, followed by Estonia (16.8 tonnes) and Sweden (15.6 tonnes).
- Luxembourg also generates 15.2 tonnes of municipal waste per capita.
- Lower municipal waste per capita figures are seen in Latvia (1.3 tonnes), Croatia (1.8 tonnes) and Portugal (1.9 tonnes).
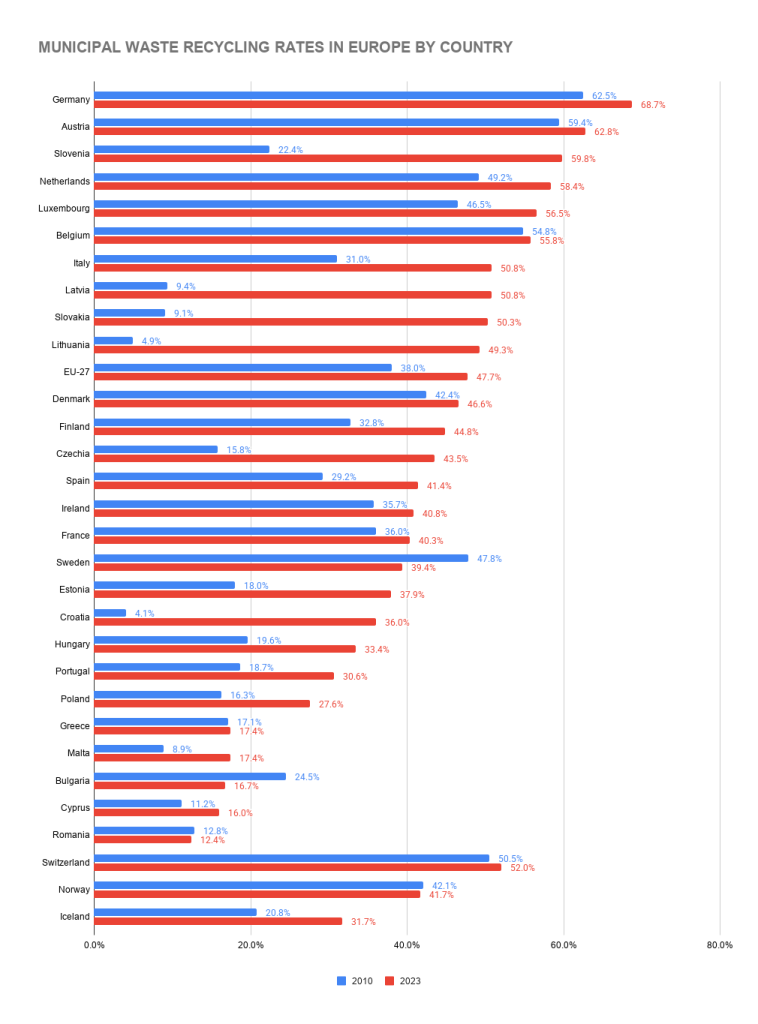
| MUNICIPAL WASTE RECYCLING RATES IN EUROPE BY COUNTRY | ||
|---|---|---|
| Countries | 2010 | 2023 |
| Germany | 62.5% | 68.7% |
| Austria | 59.4% | 62.8% |
| Slovenia | 22.4% | 59.8% |
| Netherlands | 49.2% | 58.4% |
| Luxembourg | 46.5% | 56.5% |
| Belgium | 54.8% | 55.8% |
| Italy | 31.0% | 50.8% |
| Latvia | 9.4% | 50.8% |
| Slovakia | 9.1% | 50.3% |
| Lithuania | 4.9% | 49.3% |
| EU-27 | 38.0% | 47.7% |
| Denmark | 42.4% | 46.6% |
| Finland | 32.8% | 44.8% |
| Czechia | 15.8% | 43.5% |
| Spain | 29.2% | 41.4% |
| Ireland | 35.7% | 40.8% |
| France | 36.0% | 40.3% |
| Sweden | 47.8% | 39.4% |
| Estonia | 18.0% | 37.9% |
| Croatia | 4.1% | 36.0% |
| Hungary | 19.6% | 33.4% |
| Portugal | 18.7% | 30.6% |
| Poland | 16.3% | 27.6% |
| Greece | 17.1% | 17.4% |
| Malta | 8.9% | 17.4% |
| Bulgaria | 24.5% | 16.7% |
| Cyprus | 11.2% | 16.0% |
| Romania | 12.8% | 12.4% |
| Switzerland | 50.5% | 52.0% |
| Norway | 42.1% | 41.7% |
| Iceland | 20.8% | 31.7% |
- Germany remains one of Europe’s strongest performers for municipal waste recycling at 68.7%, followed by Austria (62.8%) and Slovenia (59.8%), compared to an EU average of 47.7%. Romania (12.4%), Cyprus (16.0%) and Bulgaria (16.7%) are among the lowest.
Recycling by Age Group
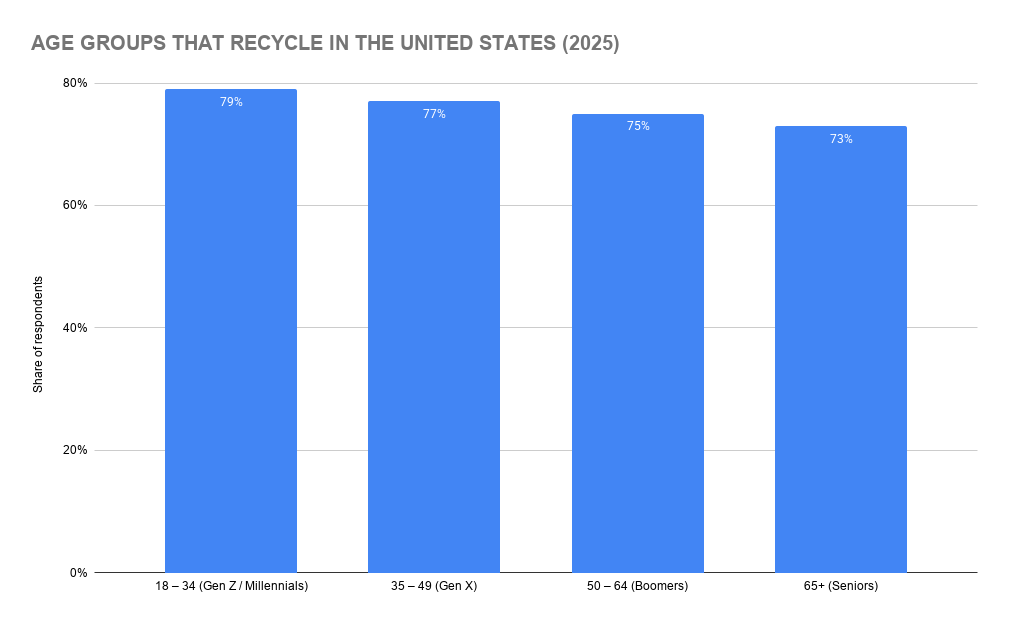
| AGE GROUPS THAT RECYCLE IN THE UNITED STATES (2025) | |
|---|---|
| Share of respondents | |
| 18 – 34 (Gen Z / Millennials) | 79% |
| 35 – 49 (Gen X) | 77% |
| 50 – 64 (Boomers) | 75% |
| 65+ (Seniors) | 73% |
- 79% of 18–34 year-olds say they recycle, compared with 73% of those aged 65+. (WM Recycling)
Global E-Waste
Electronic waste is one of the fastest-growing waste streams worldwide.
- Latest figures show 62 million tonnes were generated in 2022, with only 22.3% formally collected and recycled. By 2030, that total could reach 82 million tonnes.
- E-waste is growing 5x faster than recycling efforts.
- $62 billion worth of materials is lost annually through e-waste.
- Global e-waste increases by 2.6 million tonnes per year.
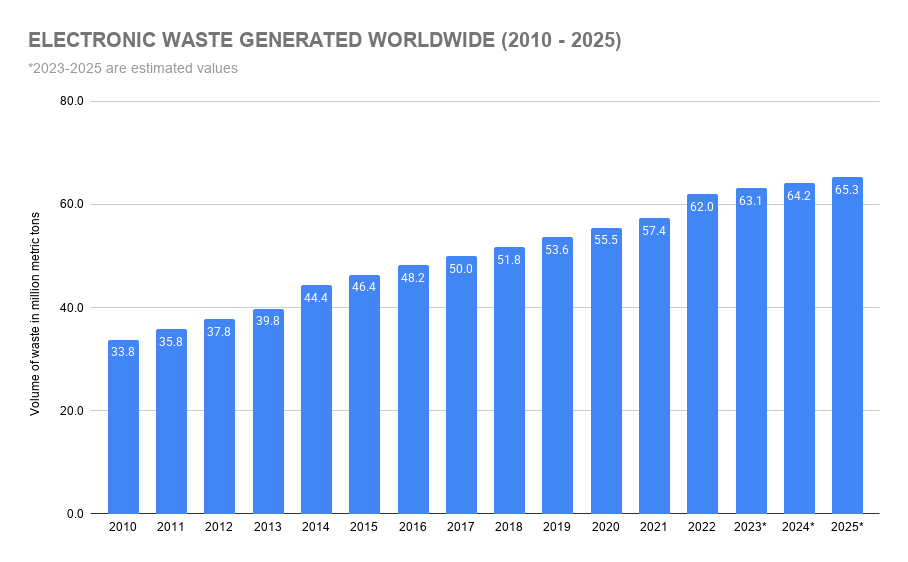
| ELECTRONIC WASTE GENERATED WORLDWIDE (2010 – 2025) | |
|---|---|
| Volume of waste in million metric tons | |
| 2010 | 33.8 |
| 2011 | 35.8 |
| 2012 | 37.8 |
| 2013 | 39.8 |
| 2014 | 44.4 |
| 2015 | 46.4 |
| 2016 | 48.2 |
| 2017 | 50.0 |
| 2018 | 51.8 |
| 2019 | 53.6 |
| 2020 | 55.5 |
| 2021 | 57.4 |
| 2022 | 62.0 |
| 2023* | 63.1 |
| 2024* | 64.2 |
| 2025* | 65.3 |
| *2023-2025 are estimated values | |
- Global e-waste has risen from 33.8 million tonnes in 2010 to 62 million tonnes in 2022.
- Current estimates put the 2025 figure at 65.3 million tonnes.
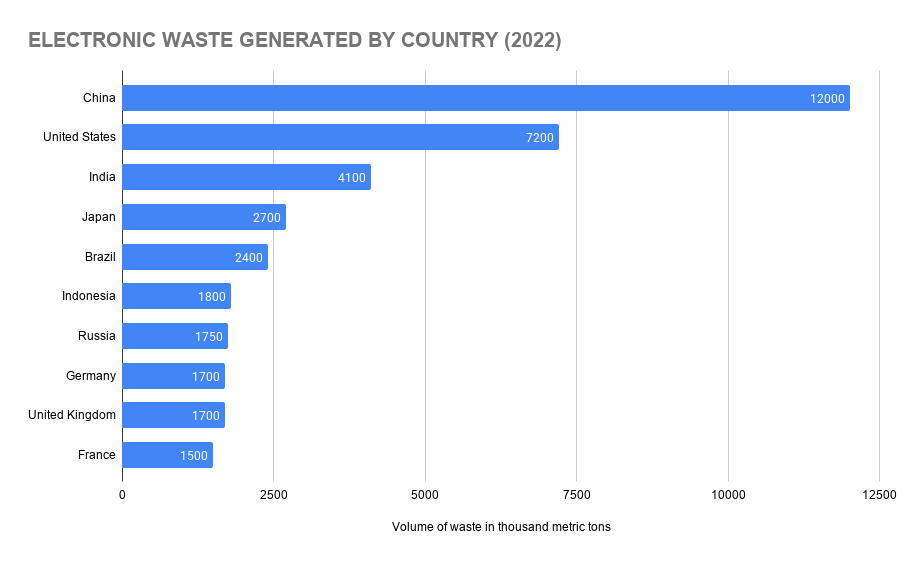
| ELECTRONIC WASTE GENERATED BY COUNTRY (2022) | |
|---|---|
| Volume of waste in thousand metric tons | |
| China | 12000 |
| United States | 7200 |
| India | 4100 |
| Japan | 2700 |
| Brazil | 2400 |
| Indonesia | 1800 |
| Russia | 1750 |
| Germany | 1700 |
| United Kingdom | 1700 |
| France | 1500 |
- China generates the largest volume in this table at 12 million tonnes.
- The United States follows on 7.2 million tonnes, with India at 4.1 million tonnes.
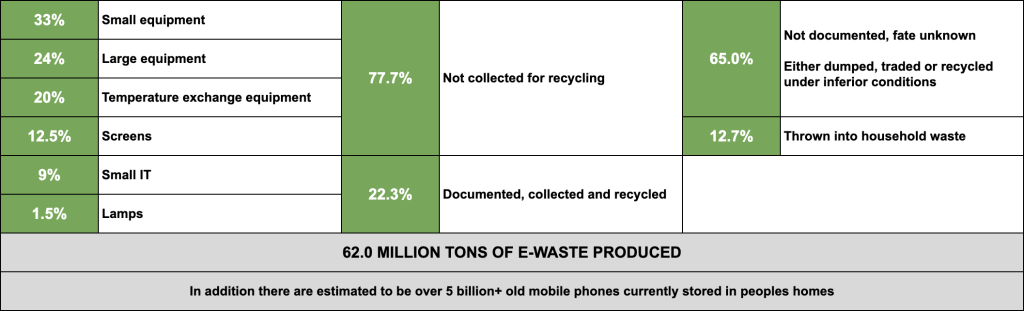
- Of the 62.0 million tons, 77.7% was not collected for recycling.
- Of the e-waste that isn’t formally recycled, a large share is not properly documented, meaning it may be dumped, traded, or processed under poorer conditions. Around 12.7% ends up in household waste, highlighting the importance of recycling electronic devices correctly.
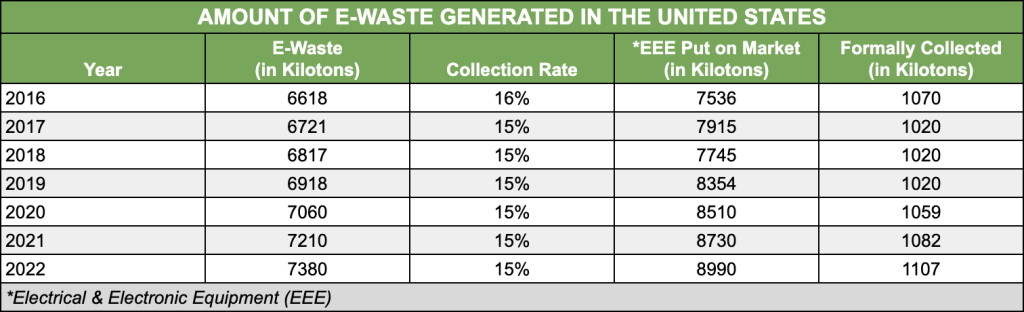
- By 2022, the US was producing 7380 kilotons of waste, and only 15% (1107 kilotons) of it was collected, despite 8990 kilotons of electronic going to market.
Old Phones and E-Waste
SellCell’s Electronics Hoarding Survey found that 78.6% of people in the UK and 76.3% in the US keep unused smartphones at home. This equates to an estimated 299 million unused devices in UK homes and 1.3 billion in the US, leaving a large volume of devices outside recycling and resale systems.
People Are Keeping Phones for Longer
SellCell’s Smartphone Brand Loyalty Survey found that 81% of iPhone users keep their devices for three years or longer, compared to 74% of Android users, with a growing share now keeping devices for four to five years. This extends device lifespans but delays when devices are recycled or re-enter the market.
SellCell Predicts: Device Lifespan and E-Waste
Global e-waste is projected to reach 82 million tonnes per year by 2030 (Global E-waste Monitor). At current recycling rates of 22.3%, over three-quarters of e-waste will remain outside official recycling systems each year. SellCell’s Electronics Hoarding Survey shows 299 million unused devices in UK homes and 1.3 billion in US homes, with a growing share of future e-waste coming from devices already sitting unused rather than newly discarded ones.
Readers can compare resale offers for phones, tablets, Macs and other tech at SellCell.com, instead of leaving devices unused or sending them to landfill.
Sources
- Global E-waste Monitor (2024):
https://ewastemonitor.info/the-global-e-waste-monitor-2024/ - World Bank – What a Waste 2.0:
https://datatopics.worldbank.org/what-a-waste/ - International Telecommunication Union (ITU):
https://www.itu.int/en/ITU-D/Environment/Pages/Publications/The-Global-E-waste-Monitor-2024.aspx - Environmental Protection Agency (EPA):
https://www.epa.gov/facts-and-figures-about-materials-waste-and-recycling - UK Government / Defra:
https://www.gov.uk/government/statistics/local-authority-collected-waste-management-annual-results
https://www.gov.uk/government/statistical-data-sets/env18-local-authority-collected-waste-annual-results-tables - Eurostat:
https://ec.europa.eu/eurostat/statistics-explained/index.php?title=Municipal_waste_statistics - European Environment Agency (EEA):
https://www.eea.europa.eu/ims/waste-recycling-in-europe - SellCell Electronics Hoarding Survey:
https://www.sellcell.com/blog/electronics-hoarding-survey/ - SellCell Smartphone Loyalty Survey:
https://www.sellcell.com/blog/smartphone-loyalty-survey-2026/ - Guinness World Records:
https://www.guinnessworldrecords.com/world-records/637682-largest-landfill-site-area - United Nations (UN):
https://population.un.org/wpp/ - Sensoneo:
https://www.sensoneo.com/global-waste-index/ - Vision Research Reports:
https://www.visionresearchreports.com/waste-management-market/39334 - PR Newswire:
https://www.prnewswire.com/news-releases/waste-management-market-to-reach-3-498-2-billion-globally-by-2032-at-5-5-cagr-allied-market-research-302010254.html - Grand View Research:
https://www.grandviewresearch.com/pipeline/waste-management-market-procurement-intelligence-report - Yale:
https://epi.yale.edu/ - OECD:
https://stats.oecd.org/ - Statista:
https://www.statista.com/statistics/233613/waste-generation-worldwide-by-region/
https://www.statista.com/statistics/186256/us-municipal-solid-waste-generation-since-1960/
https://www.statista.com/statistics/193923/recycling-of-us-municipal-solid-waste-since-1960/
https://www.statista.com/statistics/322054/total-la-collected-waste-in-england-uk/
https://www.statista.com/statistics/444744/household-recycling-rate-uk/ https://www.statista.com/statistics/499891/projection-ewaste-generation-worldwide/ - WM Recyling:
https://investors.wm.com/news-releases/news-release-details/2025-wm-recycling-report-reveals-us-recycling-say-do-gap-how/