
Find a wide range of texting and driving statistics, showing what happens when we are distracted by texting when driving, how many accidents are caused by texting and driving, and which age groups are more likely to text while driving.
This article will offer a statistical analysis of texting and driving data.
You can find out texting and driving statistics for the USA, Canada, and the United Kingdom.
The article also contains a plethora of other facts relating to the act of texting while driving.
In this article, you will discover a comprehensive range of texting and driving data. Texting and driving is a serious issue, and one that causes far too many car accidents. Texting while driving is distracting, which means that when you concentrate on your phone, you’re not looking at the road. With so many people sending texts every day, and so many people driving, accidents are bound to happen. The following sections explore the data around texting while driving (and more)…
Menu: Jump to a section
- SellCell Key Findings
- Why You Shouldn't Text and Drive
- Texting and Driving: The Statistics
- Texting and Driving Fatalities in the USA
- Texting and Driving Fatalities in the USA by Age Group
- Crashes Related to Driver Cellphone Use
- Texting and Driving vs. Alcohol Related Accidents in the USA
- Texting and Driving Fatalities in the UK
- Texting and Driving Accidents in the UK
- Mobile Phone Use While Driving in the UK
- Mobile Phone Use While Driving in the UK, by Vehicle Type
- Mobile Phone Use While Driving in the UK, by Age
- Mobile Phone Use While Driving in the UK, by Gender
- Contributing Factors to Fatal Collisions: Canada
- Texting and Driving Statistics Worldwide
- Argentina
- Australia
- Austria
- Belgium
- Chile
- Colombia
- Czech Republic
- Denmark
- Finland
- France
- Germany
- Ireland
- Italy
- New Zealand
- Nigeria
- Norway
- Poland
- Spain
- Switzerland
- Global Trends
- Attitudes to Using a Phone While Driving
- Texting and Driving Statistics: Just Don't Do It
- Sources
SellCell Key Findings:
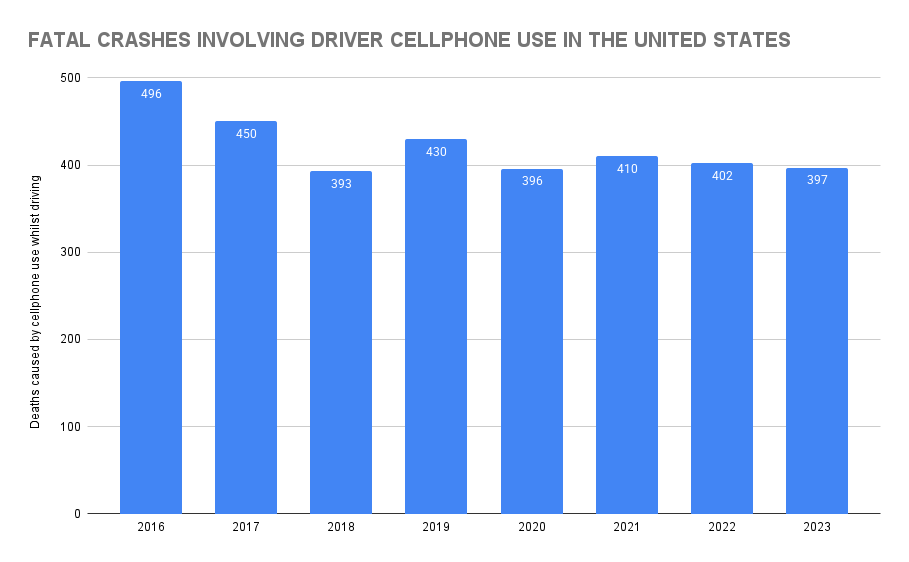
- The number of fatal crashes involving cellphone use or cellphone-related distraction in the US has fallen year-on-year, from 496 in 2016, to 397 in 2023.
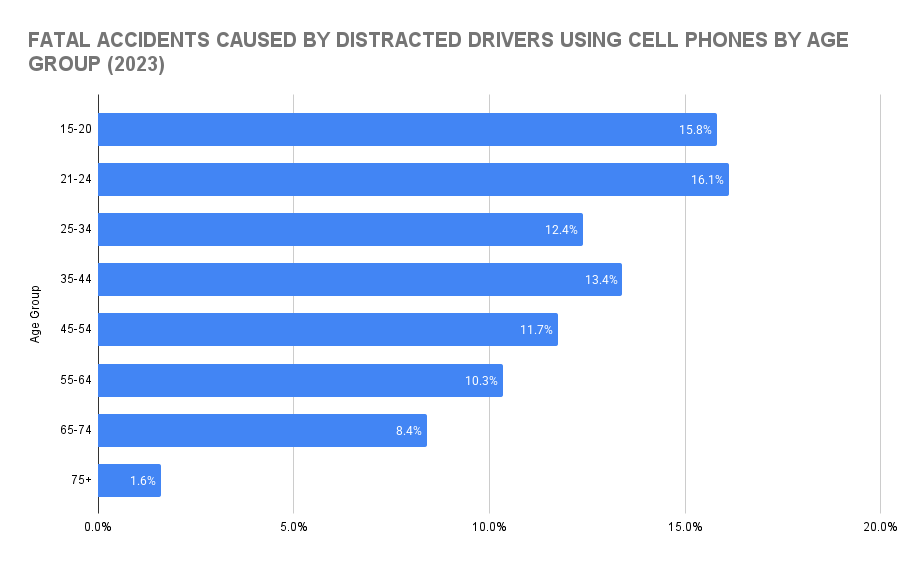
- In the US, those aged 21-24 are more responsible for crashes involving cellphone use while driving than any other age group. This age group causes 16.1% of fatal accidents.
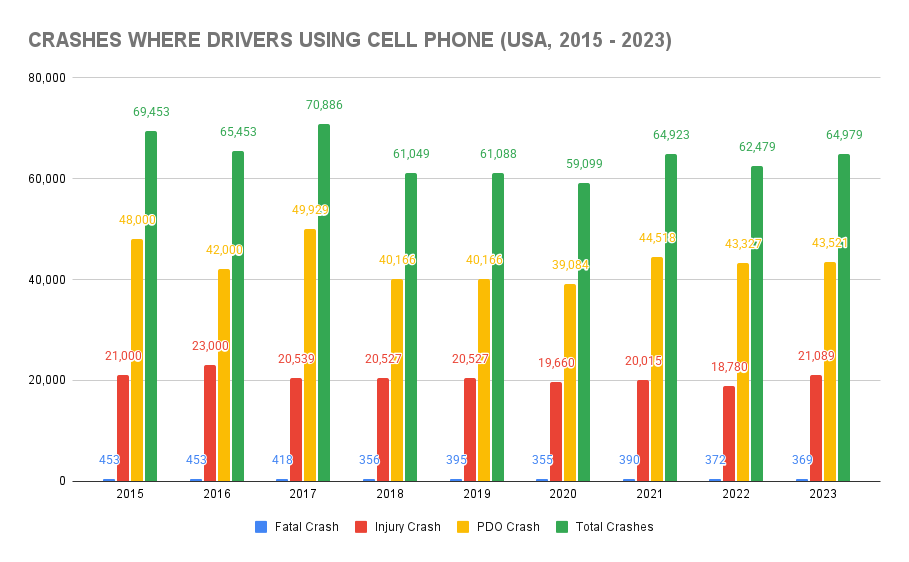
- The figures are significantly worse for all accidents (not just fatal accidents). In 2023, there were 64,979 crashes in the US involving drivers using a cellphone.
- Alcohol is still a significantly bigger contributor to road traffic accidents. In the US in 2023, there were 368 fatal crashes linked to cell phone use. There were 11,467 fatal car crashes because of alcohol use.
Why You Shouldn’t Text and Drive
Texting while driving significantly increases the risk of accidents and fatalities on the road, as our texting and driving statistics—below—show. When you text behind the wheel, your attention is divided between the road and your phone screen, impairing your ability to react quickly to sudden changes in traffic or road conditions. This distraction can lead to delayed response times, increased chances of collisions, and jeopardizes the safety of both the driver and others on the road.
Moreover, texting while driving is a form of impaired driving, akin to driving under the influence of alcohol or drugs. Texting drivers can exhibit similar impairment levels as those with a blood alcohol content above the legal limit. The cognitive demands of texting divert attention from crucial driving tasks, impairing coordination, decision-making, and situational awareness. To ensure the safety of all road users, it is imperative to prioritize undivided attention to driving and refrain from engaging in activities like texting that compromise one’s ability to operate a vehicle safely.
Texting and Driving: The Statistics
So, we know we shouldn’t text and drive; it is widely recognised that this is a dangerous behaviour. Despite this, the behaviour remains common. The following sections explore the data relating to texting and driving at the same time. The data includes sensitive topics relating to road accidents and fatalities.
Texting and Driving Fatalities in the USA
| FATAL CRASHES INVOLVING DRIVER CELLPHONE USE IN THE UNITED STATES | |
|---|---|
| Deaths caused by cellphone use whilst driving | |
| 2016 | 496 |
| 2017 | 450 |
| 2018 | 393 |
| 2019 | 430 |
| 2020 | 396 |
| 2021 | 410 |
| 2022 | 402 |
| 2023 | 397 |
- As the data above shows, back in 2016, there were 496 recorded fatal car accidents in the USA involving cellphone use or cellphone-related distraction.
- This number dropped in 2017, to 450 deaths, and again in 2018, to 393. However, we see a spike back up to 430 fatalities in 2019.
- The figures fell during 2020 (396 deaths). However, this may be partly influenced by reduced travel during COVID-19 lockdowns. Even then, the number hasn’t decreased dramatically.
- 2021 sees a spike in fatalities with 410 deaths recorded. That number has come down steadily in 2022 (402 deaths) and 2023 (397 deaths).
- It’s important to note that official crash datasets typically record “distraction” or “cellphone use” rather than specifically “texting,” so while the data reflects risky phone behaviour, it doesn’t isolate texting alone.
- There are no official numbers for 2024 or 2025 yet. The National Highway Traffic Safety Administration (NHTSA) typically takes 1-2 years to compile and verify its data.
Texting and Driving Fatalities in the USA by Age Group
| FATAL ACCIDENTS CAUSED BY DISTRACTED DRIVERS USING CELL PHONES BY AGE GROUP (2023) | |
|---|---|
| Age Group | Percentage of Distracted Drivers Using Cell Phones |
| 15-20 | 15.8% |
| 21-24 | 16.1% |
| 25-34 | 12.4% |
| 35-44 | 13.4% |
| 45-54 | 11.7% |
| 55-64 | 10.3% |
| 65-74 | 8.4% |
| 75+ | 1.6% |
- The highest proportion of fatal crashes involving cellphone-related distraction are those aged 21–24. People in this age group accounted for 16.1% of fatal crashes involving cell phone distraction.
- Ages 15-20 aren’t much better. This age group caused 15.8% of all fatal accidents due to cellphone use while driving.
- Ages 75+ cause the least fatal crashes involving cellphone distraction. This age group only accounts for 1.6% of fatal crashes caused in this way.
Crashes Related to Driver Cellphone Use
| CRASHES WHERE DRIVERS USING CELL PHONE (USA, 2015 – 2023) | ||||
|---|---|---|---|---|
| Fatal Crash | Injury Crash | PDO Crash | Total Crashes | |
| 2015 | 453 | 21,000 | 48,000 | 69,453 |
| 2016 | 453 | 23,000 | 42,000 | 65,453 |
| 2017 | 418 | 20,539 | 49,929 | 70,886 |
| 2018 | 356 | 20,527 | 40,166 | 61,049 |
| 2019 | 395 | 20,527 | 40,166 | 61,088 |
| 2020 | 355 | 19,660 | 39,084 | 59,099 |
| 2021 | 390 | 20,015 | 44,518 | 64,923 |
| 2022 | 372 | 18,780 | 43,327 | 62,479 |
| 2023 | 369 | 21,089 | 43,521 | 64,979 |
- The latest data from the NHTSA shows that in the USA in 2023 there were 64,979 total crashes in which the driver of the vehicle was using a cellphone while driving. 369 of these were fatal crashes.
- The total crashes figure was highest in 2017, when there was a total of 70,886 accidents, of which 418 were fatal.
- The highest number of fatal accidents took place in 2015 and 2016, both of which had 453 fatal crashes involving driver cellphone use.
Texting and Driving vs. Alcohol Related Accidents in the USA
| Drivers Using Cell Phones and Drivers with BAC > .08 g/dL | ||
|---|---|---|
| Age Group | Drivers Using Cell Phones | Drivers with BAC > .08 g/dL |
| 15-20 | 55 | 1030 |
| 21-24 | 48 | 1413 |
| 25-34 | 88 | 3134 |
| 35-44 | 73 | 2257 |
| 45-54 | 43 | 1562 |
| 55-64 | 37 | 1215 |
| 65-74 | 21 | 596 |
| 75+ | 3 | 260 |
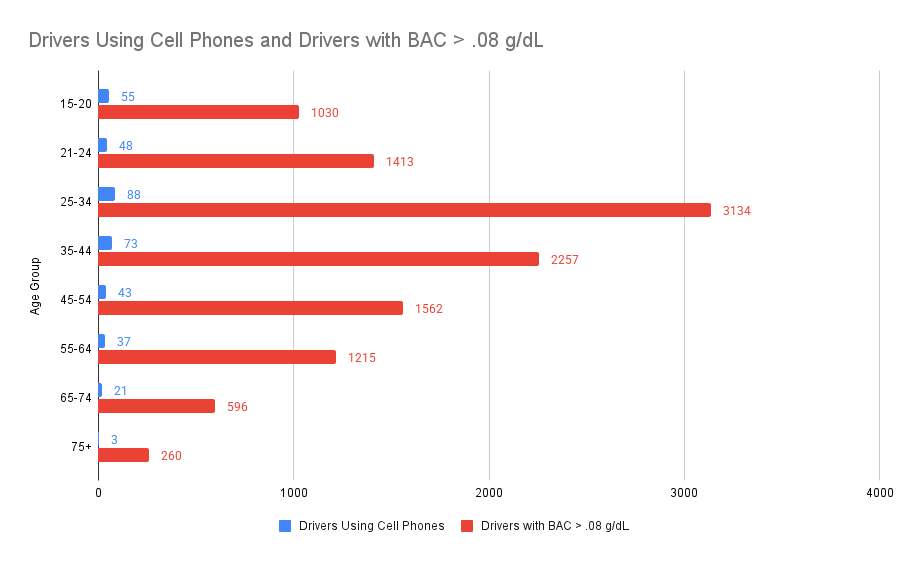
- The above data shows the number of accidents caused by people distracted by their cell phone vs. people under the influence of alcohol. More specifically, it is people considered over the legal limit for alcohol consumption. We consider drivers being alcohol impaired when their blood alcohol concentration (BAC) is .08 g/dL or higher.
- In the 15-20 age group, there were 55 accidents in 2023 linked to cellphone-related distraction. Comparatively there were 1030 accidents caused by alcohol impairment.
- The worst age group for both cell phone distraction and alcohol impairment in 2023 was 25-34. They were involved in 88 crashes involving cellphone use, but a significantly higher number of 3,134 accidents because of alcohol impairment.
- For context, while cellphone-related distraction contributed to 368 fatal crashes in the US in 2023, alcohol-impaired driving was responsible for 11,467, and speeding or excessive speed contributed to an even larger proportion of crashes, showing that distraction is a significant but not the largest factor.
- More broadly, distraction is estimated to contribute to a notable share of crashes overall, highlighting the wider impact beyond just mobile phone use. 19
Texting and Driving Fatalities in the UK
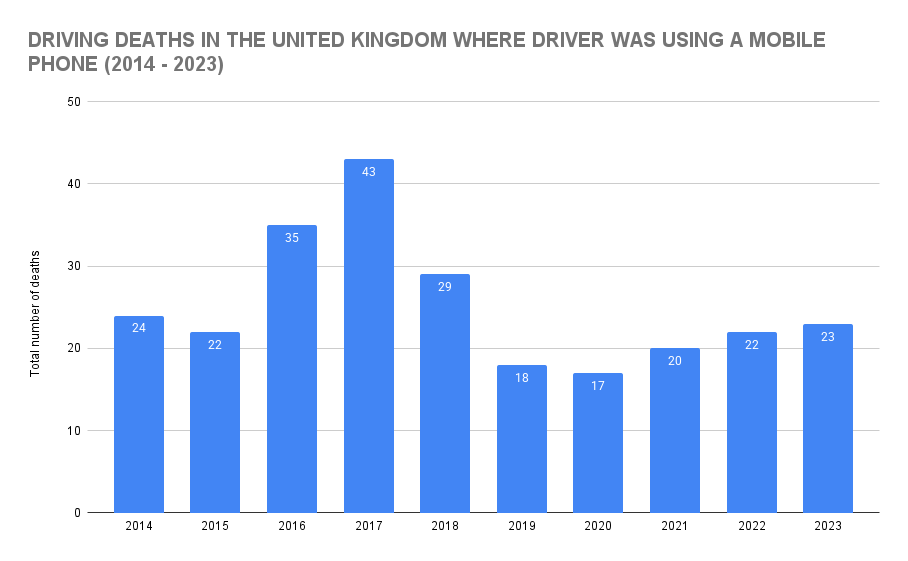
| DRIVING DEATHS IN THE UNITED KINGDOM WHERE DRIVER WAS USING A MOBILE PHONE (2014 – 2023) | |
|---|---|
| Total number of deaths where driver using a mobile phone | |
| 2014 | 24 |
| 2015 | 22 |
| 2016 | 35 |
| 2017 | 43 |
| 2018 | 29 |
| 2019 | 18 |
| 2020 | 17 |
| 2021 | 20 |
| 2022 | 22 |
| 2023 | 23 |
- In 2014, the number of deaths in the UK related to mobile phone use was 24. The following year, it dropped to 22 deaths.
- The numbers started rising in 2016, with a sharp jump up to 35, and then 2017 saw the highest number yet, with 43.
- 2020 saw the lowest number, with 17 deaths caused by phone distraction. Since, then the number has been slowly rising, 20 deaths in 2021, 22 deaths in 2022 and 23 deaths in 2023.
- These statistics as well as the ones that follow regarding mobile phone usage come from the most recent survey available on this topic from the UK Government’s website.
- There are some provisional figures for road casualties in 2024 which shows 1,633 road deaths and 29,537 people killed or seriously injured. But, the detailed cause breakdowns (like mobile phone use) take longer to publish, which is why our figures only run to 2023. 16
Texting and Driving Accidents in the UK
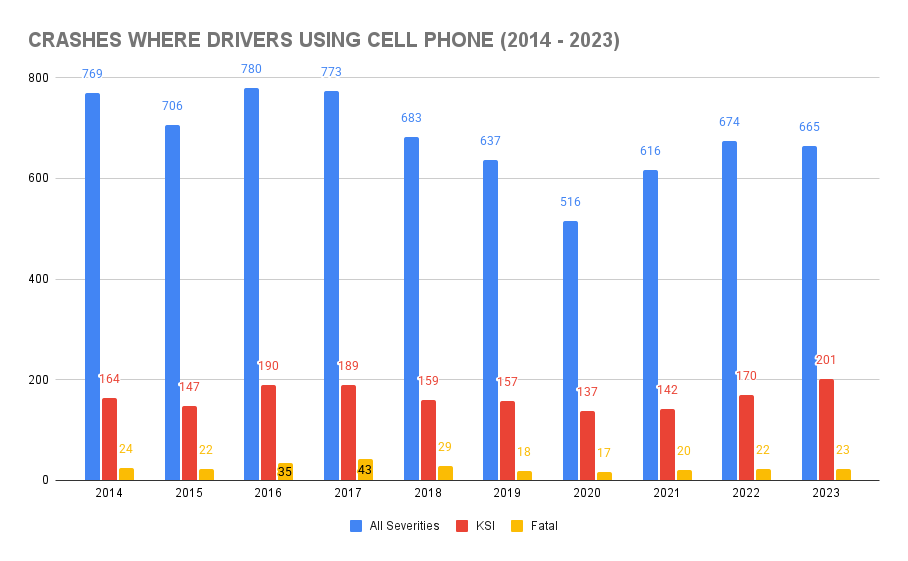
| CRASHES WHERE DRIVERS USING CELL PHONE (2014 – 2023) | |||
|---|---|---|---|
| All Severities | KSI | Fatal | |
| 2014 | 769 | 164 | 24 |
| 2015 | 706 | 147 | 22 |
| 2016 | 780 | 190 | 35 |
| 2017 | 773 | 189 | 43 |
| 2018 | 683 | 159 | 29 |
| 2019 | 637 | 157 | 18 |
| 2020 | 516 | 137 | 17 |
| 2021 | 616 | 142 | 20 |
| 2022 | 674 | 170 | 22 |
| 2023 | 665 | 201 | 23 |
- The data above shows all crashes of all severities, compared with crashes where people were killed or seriously injured (KSI), and fatal crashes. These were all accidents caused by cell phone use while driving in the UK.
- While there may have been a relatively low yet totally avoidable 24 deaths in 2014, involving drivers using mobile phones, there were 769 accidents caused by cell phone use. If we remove the 24 fatalities from the KSI statistic for 2014 (164 people KSI), that leaves 140 people who were seriously injured.
- In 2023, there were 665 total accidents relating to phone use while driving. 201 of them were KSI, and there were 23 fatalities.
Mobile Phone Use While Driving in the UK
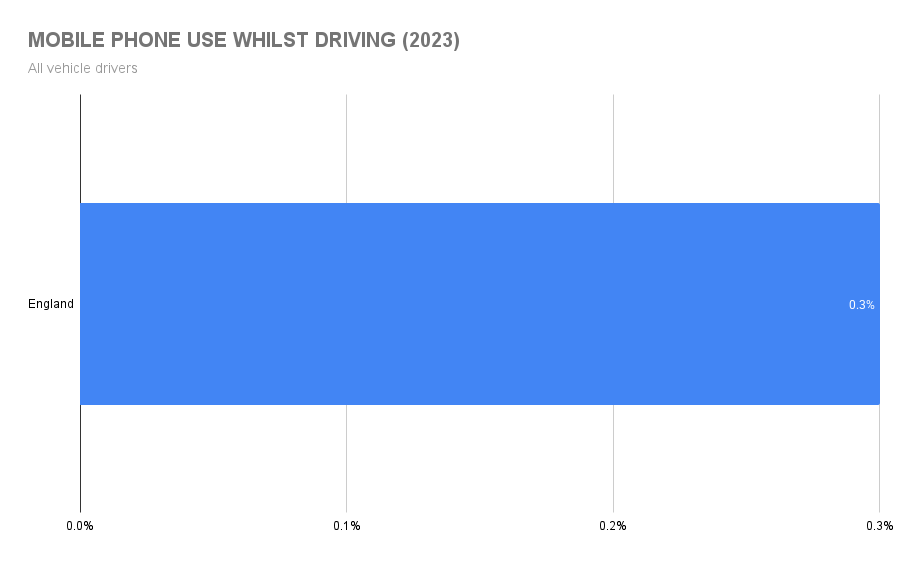
| MOBILE PHONE USE WHILST DRIVING (2023) | |
|---|---|
| All vehicles | |
| England | 0.3% |
- According to UK government statistics on mobile phone use while driving, 0.3% of all observed drivers in England were seen operating a mobile phone.
- A similar proportion was recorded for Scotland based on data collected in early 2024.
- More recent self-reported data suggests that 4.3% of drivers admit to using a phone while driving, with over half saying they use hands-free devices at least occasionally. This indicates that the 0.3% observed in UK government statistics may underestimate the true prevalence of mobile phone use behind the wheel.
Mobile Phone Use While Driving in the UK, by Vehicle Type
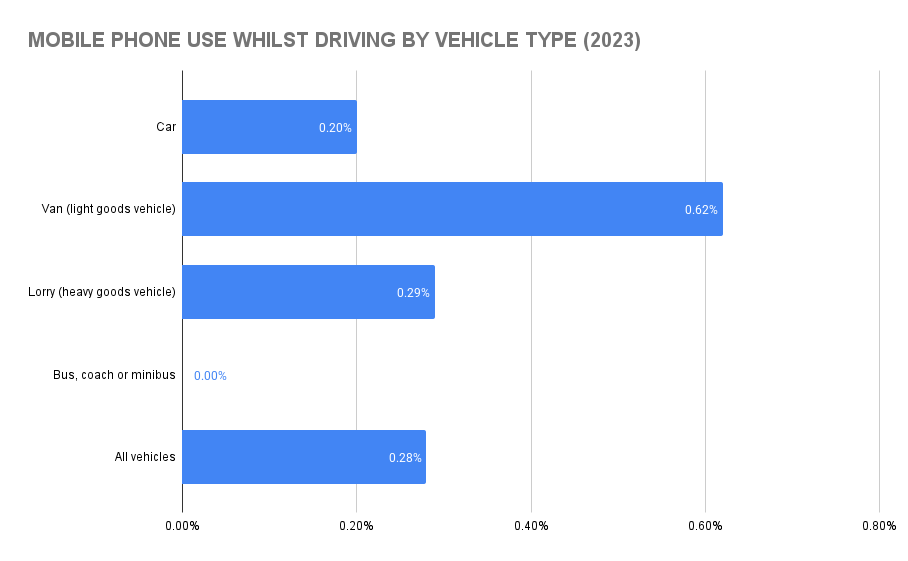
| MOBILE PHONE USE WHILST DRIVING BY VEHICLE TYPE (2023) | |||
|---|---|---|---|
| Vehicle Type | Percentage | ||
| Car | 0.20% | ||
| Van (light goods vehicle) | 0.62% | ||
| Lorry (heavy goods vehicle) | 0.29% | ||
| Bus, coach or minibus | 0.00% | ||
| All vehicles | 0.28% | ||
- Van drivers were the most likely to use a mobile phone while driving, with 0.62% observed doing so.
- HGV’s come second, with 0.29% of their drivers using a phone whilst driving. This presents a particularly high level of risk due to the size of these vehicles.
- No bus/coach/minibus drivers were observed using a phone use whilst driving.
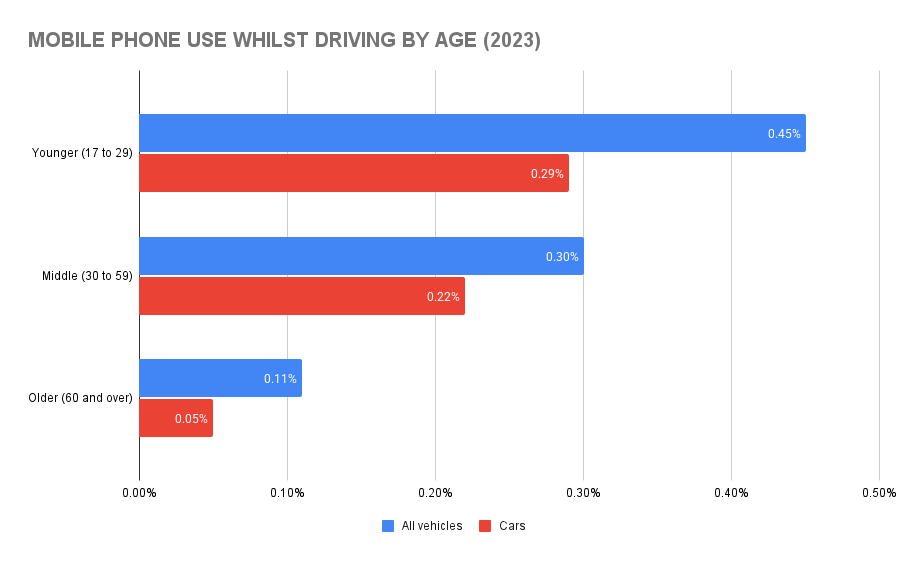
Mobile Phone Use While Driving in the UK, by Age
| MOBILE PHONE USE WHILST DRIVING BY AGE (2023) | |||
|---|---|---|---|
| All vehicles | Cars | ||
| Younger (17 to 29) | 0.45% | 0.29% | |
| Middle (30 to 59) | 0.30% | 0.22% | |
| Older (60 and over) | 0.11% | 0.05% | |
- Young people had the highest observed rates in terms of phone use when in command of a vehicle. Of those aged 17-29, the percentages are 0.45% for all vehicles and 0.29% for cars.
- Those aged 30-59 also account for a high proportion, with 0.30% for all vehicles and 0.22% for cars.
- The older generations (60 and over) use their phones least when driving, with only 0.11% for all vehicles and 0.05% for cars.
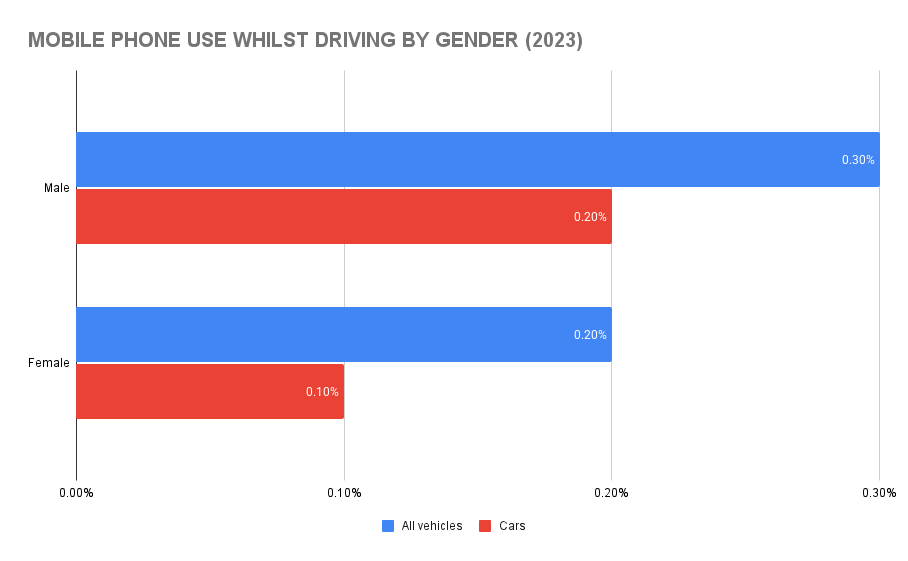
Mobile Phone Use While Driving in the UK, by Gender
| MOBILE PHONE USE WHILST DRIVING BY GENDER (2023) | ||
|---|---|---|
| All vehicles | Cars | |
| Male | 0.30% | 0.20% |
| Female | 0.20% | 0.10% |
- Males are more likely to use their phone while driving in the UK. 0.3% for all vehicles and 0.2% for cars of those observed using their phone were male.
- Females aren’t doing much better, though. 0.2% for all vehicles and 0.1% for cars of those observed using a phone were female.
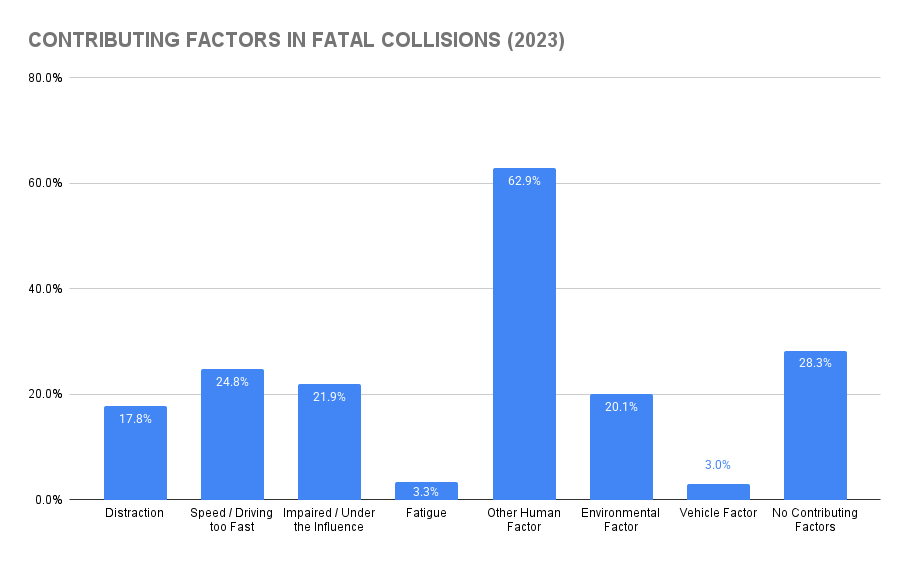
Contributing Factors to Fatal Collisions: Canada
| CONTRIBUTING FACTORS IN FATAL COLLISIONS (2023) | |
|---|---|
| Contributing Factors* | |
| Distraction | 17.8% |
| Speed / Driving too Fast | 24.8% |
| Impaired / Under the Influence | 21.9% |
| Fatigue | 3.3% |
| Other Human Factor | 62.9% |
| Environmental Factor | 20.1% |
| Vehicle Factor | 3.0% |
| No Contributing Factors | 28.3% |
| * There will be double counting because there are multiple contributing factors reported for most collisions ** NOTE: These data were estimated using submissions from a subset of Canada’s provinces and territories. | |
- Little data exists relating to texting while driving in Canada. The above data is from Canadian collision statistics.
- The data shows “distraction caused” 17.8% of fatal collisions, and mobile phone use while driving would fall under this category.
- Again, this data is a couple of years old but represents the most up to date dataset from the Canadian Government’s website.
Texting and Driving Statistics Worldwide
While global data isn’t as detailed as that from the US and the UK, statistics from the International Transport Forum highlight that cellphone-related distracted driving is a widespread issue worldwide. Data availability and consistency vary by country, so comprehensive global comparisons remain limited. 8
Estimates suggest that between around 20% and 40% of drivers report using a mobile phone while driving, depending on the region and method of measurement. 18
Argentina
Distraction poses a growing challenge to traffic safety in Argentina. In 2018, a comprehensive nationwide observational analysis, drawing from a sample exceeding 95,000 cars, revealed that, at any given time, 16.8% of car drivers were engaged in distracting activities. The primary source of distraction was identified as mobile phone usage while driving a car (9.4%).
Australia
The increased reliance on mobile phones and other devices has raised concerns about distracted driving in Australia. However, there is no official definition for “distracted driving” in national statistics. Mobile phone use, in particular, is worrisome. In 2020, there were 56,232 reported infringements, a 41.7% decrease from 2019. It is illegal to use a handheld phone while driving in Australia.
Austria
In 2020, Austria’s road crash data showed that 21.5% of road deaths were likely because of distraction, like not paying attention or missing other road users. This was lower than the 24% recorded in 2019. Mobile phone use is considered a distracting factor.
Belgium
In Belgium, a growing issue for traffic safety is distraction, like using mobile phones while driving. It’s against the law to use handheld phones while driving, but using hands-free devices is allowed. In 2015, a quick survey in three large Belgian cities found that 7% of car drivers and 9% of light goods vehicle drivers used their mobile phones while waiting at traffic lights.
Chile
In 2020, police data showed distracted driving caused 223 road deaths (12.5% of all deaths) and 1,744 serious injuries. Fatalities went up by 33%, but serious injuries decreased by 5% compared to 2019. Chilean traffic law sees driving with a mobile phone, unless hands-free, as a serious violation.
Colombia
In Colombia, a growing issue for traffic safety is distraction, like using mobile phones while driving or walking. However, there aren’t official stats on how common distraction is in crashes. It’s against the rules to drive with a handheld phone, but using hands-free phones is allowed.
Czech Republic
In the Czech Republic, a rising issue for traffic safety is distraction, like using mobile phones while driving. It’s against the law to drive with a handheld phone or other electronics, but using hands-free devices is allowed. In 2020, about 2% of drivers were estimated to use a mobile phone while driving.
Denmark
Distraction is believed to play a part in 38% of deadly crashes in Denmark. Detailed crash studies reveal that distraction is a problem when driving a vehicle. Using a handheld mobile phone while driving is against the law in Denmark, but using hands-free devices is allowed.
Finland
In Finland, you can’t drive with a handheld phone, but using hands-free devices is okay. About three deadly crashes each year are linked to using a mobile phone while driving.
France
In France, traffic safety faces a growing issue: distraction, like using mobile phones while driving. In 2020, about 13% of deadly crashes happened because of distracted attention. It’s against the rules to drive with a handheld phone, but using hands-free phones is permitted.
Germany
In Germany, using a handheld phone while driving is against the law. Studies check how many drivers use smartphones, through the use of roadside observations. The first study in 2019 showed 3% of car drivers use their smartphones, 2% type with at least one hand off the wheel, and 1% talk on the phone, with about half of them holding it.
Ireland
In Ireland, distraction, especially from using mobile phones while driving, is becoming a bigger traffic safety issue. Rules against using mobile phones while driving started in May 2014. It’s considered an offense to hold a mobile phone while driving. A survey in 2018 found that out of 14,221 drivers observed, 8% were using their mobile phones (4% holding it to their ear and 4% in their hand).
Italy
In Italy in 2020, distraction was thought to be the main reason for 15.7% of road crashes—13.9% in cities and 20.6% on highways. Penalties for not following Article 173 of the Italian Highway Code, related to phone use, decreased less than usual in 2020. Traffic and local police data show that 98% of these penalties were because people were using phones and smartphones incorrectly while driving.
New Zealand
In New Zealand in 2019, driver distraction played a part in 15 deadly crashes (5% of 300), 133 serious injury crashes, and 932 minor injury crashes. Even though using mobile phones while driving is against the law in New Zealand, it’s still an issue, with 60% of drivers admitting to doing it.
Nigeria
In Nigeria, distraction, like using mobile phones while driving, remains an issue. In 2016, about 0.3% of deadly crashes were thought to be because of using a phone while driving. Driving with a mobile phone, even with hands-free devices, is against the rules in Nigeria.
Norway
In Norway, the law says mobile phones must be properly fixed on the car’s instrument panel, close to the driver. Hands-free devices are allowed. In 2019, out of 50 deadly crashes, some kind of distraction played a part, and five of those were because of using mobile phones.
Poland
In Poland, it’s against the law to use hand-held mobile phones while driving, but hands-free phones are allowed. A survey in 2016 found that about 4% of drivers in cars use hand-held mobile phones.
Spain
Distraction played a role in 17% of injury crashes and 31% of deadly crashes in Spain in 2020. It’s a bigger problem outside cities (37% of deadly crashes). Since 2002, using hand-held phones while driving has been against the rules; only hands-free phones are allowed.
Switzerland
In Switzerland in 2020, distraction, such as that from smartphones, was the main reason for 12% of deadly crashes. The BFU carried out a survey for the first time that year, and it found that almost 30% of drivers get distracted while driving, mainly by talking to passengers, and 5% by using a cellphone.
Global Trends
Recent research shows that mobile phone use remains one of the most common driver distractions worldwide. Studies also suggest that drivers who use mobile phones while driving are about four times more likely to be involved in a crash. 14
Although distracted driving remains a serious issue, some recent data indicates slight improvements. For example, telematics data showed an 8.6% reduction in distracted driving behaviour in 2024, helping prevent thousands of crashes and injuries. 15
Attitudes to Using a Phone While Driving
So, we know people are using their phones, and the texting and driving statistics speak for themselves. However, what do people think about using a phone while they are in charge of a vehicle?
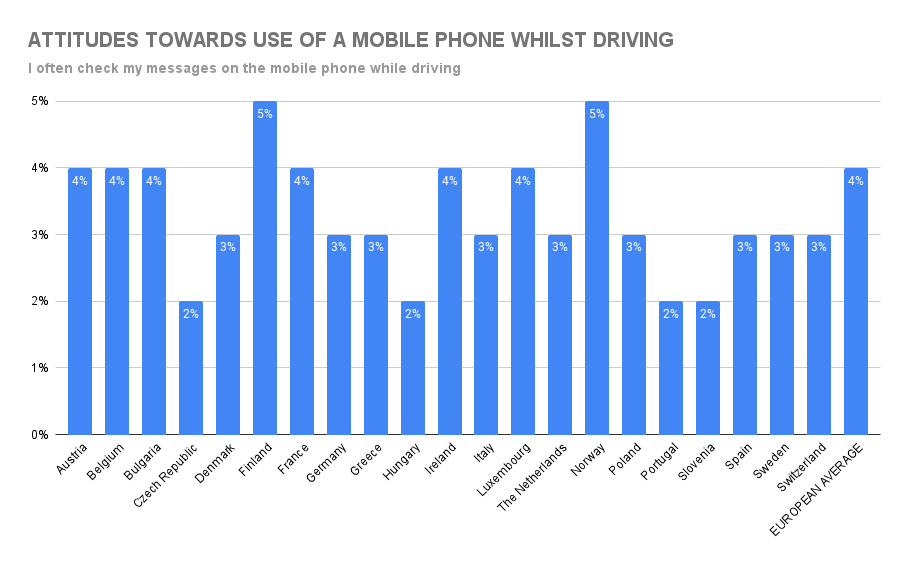
“I often check my messages on the mobile phone while driving.”
| ATTITUDES TOWARDS USE OF A MOBILE PHONE WHILST DRIVING | |
|---|---|
| I often check my messages on the mobile phone while driving | |
| Austria | 4% |
| Belgium | 4% |
| Bulgaria | 4% |
| Czech Republic | 2% |
| Denmark | 3% |
| Finland | 5% |
| France | 4% |
| Germany | 3% |
| Greece | 3% |
| Hungary | 2% |
| Ireland | 4% |
| Italy | 3% |
| Luxembourg | 4% |
| The Netherlands | 3% |
| Norway | 5% |
| Poland | 3% |
| Portugal | 2% |
| Slovenia | 2% |
| Spain | 3% |
| Sweden | 3% |
| Switzerland | 3% |
| EUROPEAN AVERAGE | 4% |
- As the graph shows, the European average for people who admit they often check messages while driving is 4%.
- Finland and Norway have the highest proportion, with 5% each, while Czech Republic, Hungary, Portugal, and Slovenia, are lowest with 2% each.
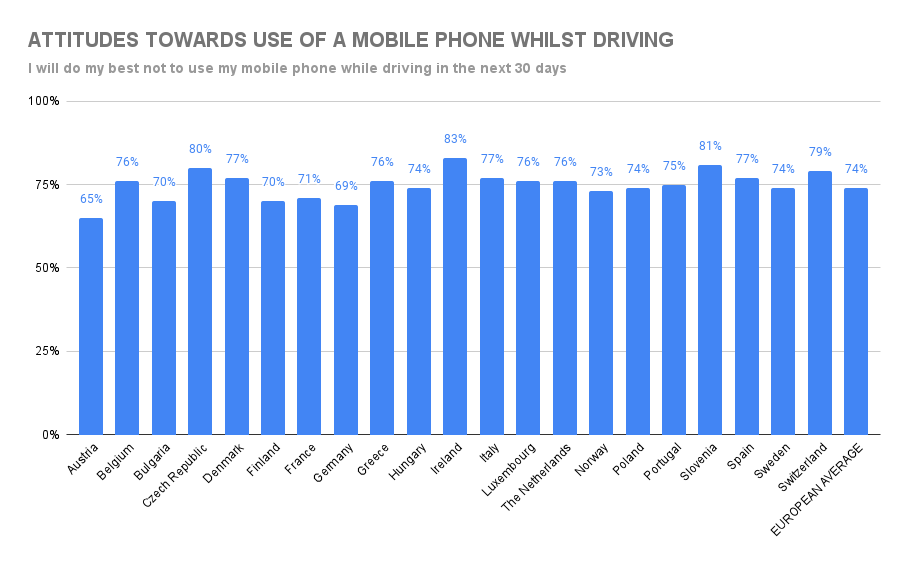
“I will do my best not to use my mobile phone while driving in the next 30 days.”
| ATTITUDES TOWARDS USE OF A MOBILE PHONE WHILST DRIVING | |
|---|---|
| I will do my best not to use my mobile phone while driving in the next 30 days | |
| Austria | 65% |
| Belgium | 76% |
| Bulgaria | 70% |
| Czech Republic | 80% |
| Denmark | 77% |
| Finland | 70% |
| France | 71% |
| Germany | 69% |
| Greece | 76% |
| Hungary | 74% |
| Ireland | 83% |
| Italy | 77% |
| Luxembourg | 76% |
| The Netherlands | 76% |
| Norway | 73% |
| Poland | 74% |
| Portugal | 75% |
| Slovenia | 81% |
| Spain | 77% |
| Sweden | 74% |
| Switzerland | 79% |
| EUROPEAN AVERAGE | 74% |
- Data shows that a lot of people will endeavour not to use their mobile phone when driving. 83% of Ireland’s drivers promised to do this; the largest percentage in Europe.
- According to the European Survey of Road Users Attitudes (ESRA), around 12% of drivers across Europe admit to reading or sending text messages while driving, highlighting that this is a widespread behaviour despite awareness campaigns.
- More recent European data suggests that nearly one in four drivers admit to checking messages or apps while driving, indicating that mobile phone distraction remains widespread. 17
- Only 65% of Austrians are happy to pledge towards less phone use while driving.
Texting and Driving Statistics: Just Don’t Do It
The above statistics are damning. If you use a phone while you are driving, you are at a much greater risk of causing a fatal accident than if you have your attention on the road at all times. So, if you are making a journey in the car, wait until you reach your destination before you start texting. Or, at the very least, pull over when it is safe to do so. Texting and driving at the same time is incredibly dangerous.
Research indicates that drivers using a mobile phone are roughly four times more likely to be involved in a crash than those who are not, emphasizing the significant risk associated with distracted driving.
Sources
- Forbes
- NHTSA
- NHTSA
- NHTSA
- Assets Publishing Service
- GOV.UK
- CANADA.CA
- ITF-OECD.org
- Transport.ec
- NHTSA
- NHTSA
- GOV.UK
- CANADA.CA
- RSA.IE
- CMTELEMATICS.COM
- GOV.UK
- European Road Safety Observatory (2024)
- American Association for Automotive Medicine (AAAM) / global survey data
- NHTSA / general distracted driving data (2023)
Our content is created in good faith and reviewed regularly - if you spot an error, please contact corrections@sellcell.com. Read our Editorial Policy