But iPhone 16 Still Retains Around 10% More : Should Buyers Move to iPhone 17 Instead?
"iPhone 16e leads the budget category on resale value, but our depreciation data shows the standard iPhone continues to deliver the strongest pound-for-pound investment — a pattern likely to continue when buyers compare the upcoming iPhone 17e with the standard iPhone 17."
Key Findings
- iPhone 16e retains up to roughly 12% more resale value than Galaxy FE devices after 12 months when comparing entry-tier phones.
- Standard iPhone 16 retains around 10–11% more value than iPhone 16e across matched 12-month timelines.
- Budget devices can retain as little as around 36% of MSRP after one year, compared with roughly 60% for the standard iPhone 16.
- Within the budget segment analysed, iPhone 16e shows the strongest overall resale value retention.
Introduction
With Apple expected to introduce the iPhone 17e during its early-March “Special Experience” window, buyers are weighing whether the upcoming 17e is likely to be the best-value option or whether it will still be worth stretching to the standard iPhone 17 for stronger long-term value retention. Reports suggest Apple is preparing several announcements around early March, continuing its spring refresh cycle (Source: macrumors.com).
Budget phones often look like the smartest buy at launch, but resale performance over the first year can tell a very different story. To test that assumption ahead of the 17e, this analysis compares MSRP against resale values for today’s closest equivalents — iPhone 16e versus Pixel a-series and Galaxy FE — and benchmarks those results against the standard iPhone 16.
Main Findings
- iPhone 16e (128GB) launches at $599 and averages about $291 after 12 months, retaining roughly 48.6% of its original price.
- Pixel 8a (128GB) launches at $499 and averages about $238 after 12 months — roughly 47.7% retained.
- Galaxy S24 FE (128GB) launches at $649.99 and averages around $236 after one year, retaining roughly 36.3%, the lowest retention among devices compared.
- Across storage tiers, iPhone 16e averages about 51.5% depreciation after 12 months, compared with Pixel 8a at around 52.8% and Galaxy S24 FE at roughly 63.5%.
- Standard iPhone 16 (128GB) launches at $799 and averages roughly $476 at 12 months, retaining about 59.6%, creating an approximate 10–11 percentage-point retention gap versus iPhone 16e.
- The difference between iPhone 16e and Galaxy S24 FE retention reaches roughly 12 percentage points at the one-year mark, while the gap between iPhone 16e and Pixel 8a remains close to one point.
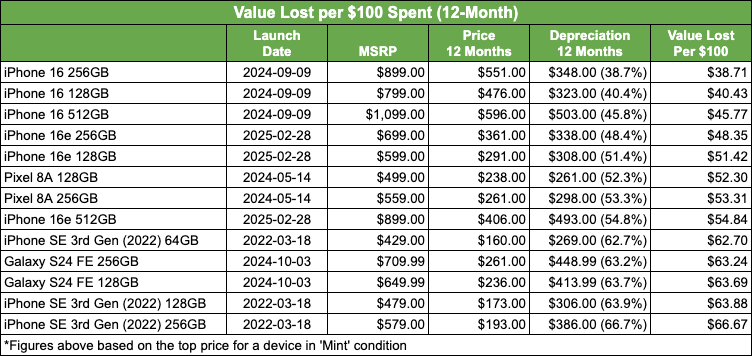
Second Lens: Pound-for-Pound Depreciation (Value Lost per $100 Spent)
A second way to view depreciation is to measure how much value is lost relative to each $100 of original MSRP. This view removes price bias between devices and highlights how much value buyers actually lose relative to what they paid.
- iPhone 16 loses roughly $38–46 per $100 spent after 12 months depending on storage tier.
- Pixel 8a loses roughly $52–53 per $100 spent.
- Galaxy S24 FE loses roughly $63 per $100 spent.
- iPhone SE (3rd Gen) reaches up to about $66 lost per $100 spent.
- iPhone 16e loses roughly $48–55 per $100 spent across all configurations, with the higher end reflecting Apple’s 512GB tier, which is not offered on Pixel a-series or Galaxy FE models. When comparing only like-for-like 128GB and 256GB configurations, iPhone 16e falls to roughly $48–$51 lost per $100 spent versus Pixel a-series devices at around $52–$53 — meaning the iPhone 16e still edges Pixel on pound-for-pound resale value.
- For consistency, it’s also worth noting that iPhone 16 includes a 512GB configuration not offered by Pixel a-series or Galaxy FE devices; limiting the comparison to 128GB and 256GB tiers narrows the range further, reflecting even tighter pound-for-pound value retention for the standard iPhone model.
This second lens reinforces the main depreciation findings: iPhone 16 shows the strongest pound-for-pound value retention overall, while iPhone 16e leads within the budget category.
Charts and Main Findings
Budget comparison overview (12 months)


- iPhone 16e retains roughly 45–52% of MSRP after one year depending on storage configuration.
- Pixel 8a retains approximately 47–48% over the same timeframe.
- Galaxy S24 FE retains roughly 36–37% after 12 months.
- iPhone 16 benchmark retains roughly 60–61%, the highest retention shown.
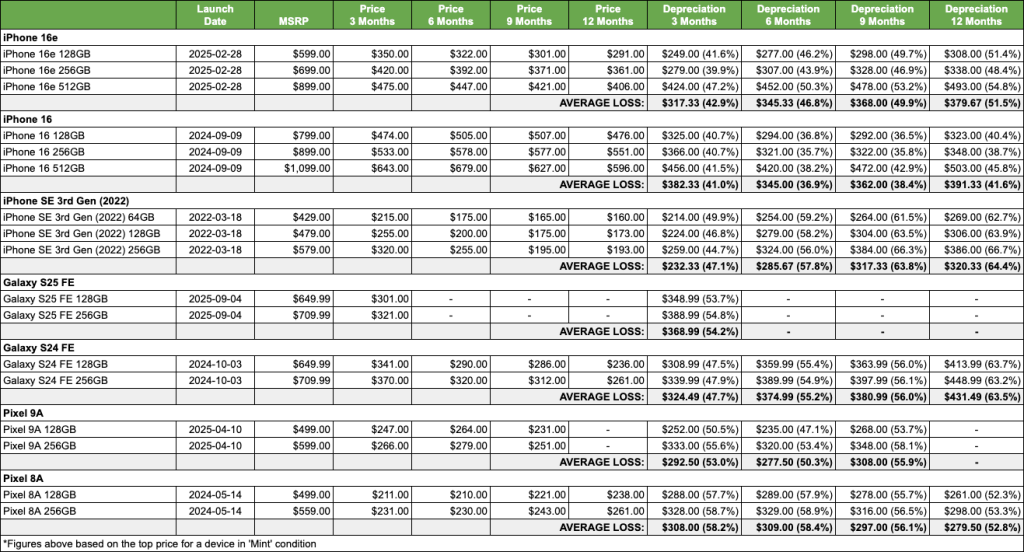
iPhone 16e depreciation performance
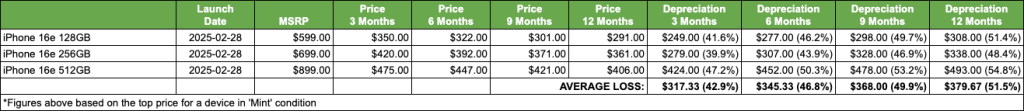
- 128GB moves from $599 MSRP to about $291 at 12 months.
- 256GB moves from $699 to around $361 at 12 months.
- 512GB moves from $899 to roughly $406 after one year.
- Average depreciation across configurations sits around 51.5%.
Pixel a-Series depreciation
- 128GB moves from $499 MSRP to about $238 at 12 months.
- 256GB moves from $559 to around $261 at 12 months.
- Average depreciation sits just below 53%.
Galaxy FE depreciation

- 128GB moves from $649.99 MSRP to roughly $236 after 12 months.
- 256GB moves from $709.99 to about $261 at one year.
- Average depreciation reaches roughly 63.5%.
Apple vs Apple — iPhone 16e vs iPhone 16
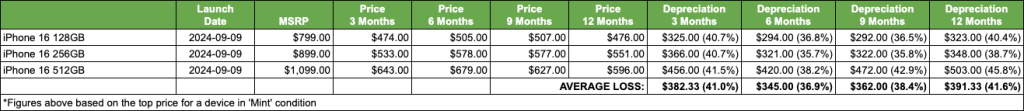
- iPhone 16 (128GB) moves from $799 MSRP to roughly $476 at 12 months.
- Average depreciation across storage tiers sits around 41.6%.
- Retention gap between iPhone 16 and iPhone 16e is roughly 10–11 percentage points at one year.
Early depreciation indicators

- Pixel 9a shows mid-50% depreciation by month nine.
- Galaxy S25 FE shows early depreciation above 50% within three months.
Conclusion
Across matched 12-month comparisons, iPhone 16e leads the budget category on resale value retention, outperforming Pixel a-series and Galaxy FE rivals. However, the standard iPhone 16 retains more value overall and shows the strongest depreciation efficiency when measured on a pound-for-pound basis. For buyers considering a future iPhone 17e, the data suggests the 16e remains one of the strongest budget options, while the standard iPhone tier continues to offer the strongest long-term investment performance.
If depreciation trends hold, buyers choosing between a future 17e and standard 17 are likely to see the same pattern — the budget model may offer strong entry-level value, but the standard model is likely to remain the stronger long-term investment based on current resale trends and historical retention patterns.
Methodology
All figures are based on Mint-condition resale pricing compared against original MSRP. Twelve-month comparisons were prioritised to ensure like-for-like analysis across the budget segment. Value lost per $100 spent is calculated by dividing total depreciation by MSRP and multiplying by 100, allowing devices with different launch prices to be compared on an equal basis.
Our content is created in good faith and reviewed regularly - if you spot an error, please contact corrections@sellcell.com. Read our Editorial Policy