7% lower depreciation than the iPhone 16 Pro Max may be fuelling early resale behaviour
"Despite launching only months ago, the iPhone 17 Pro Max has become the most traded-in device, with depreciation running over 7% lower than the previous generation — helping drive unusually early resale behaviour."
Key Findings
- The iPhone 17 Pro Max already accounts for 11.5% of all Top-20 trade-ins, ranking number one just months after launch.
- Slower depreciation is helping drive early resale, with the iPhone 17 Pro Max losing around 25.4% of its value versus roughly 32.5% for the iPhone 16 Pro Max — over 7% less value loss over the same 145-day period.
- Around 76.5% of trade-ins are unlocked, suggesting sellers are deliberately timing resale while prices remain strong.
Introduction
Trade-in rankings usually reflect a broad mix of devices at different stages of their lifecycle, with many models appearing months or even years after launch rather than immediately. That’s what makes the rise of the iPhone 17 Pro Max particularly unusual. Despite releasing only recently, Apple’s latest flagship has quickly become the most traded-in device across the independent trade-in market.
This report looks at how the iPhone 17 Pro Max climbed the trade-in rankings so quickly, what early depreciation data reveals about resale behaviour, and why some owners may be choosing to sell far sooner than expected. While early trade-ins might suggest dissatisfaction at first glance, the data points to a more nuanced picture shaped by strong value retention, changing upgrade habits and wider economic pressures.
Main Findings
- The iPhone 17 Pro Max now accounts for 11.5% of all Top-20 trade-ins, making it the number-one traded-in device despite launching only recently.
- Mint-condition iPhone 17 Pro Max devices have depreciated by around 25.4% since launch — roughly 7% less than the iPhone 16 Pro Max, which lost about 32.5% of its value over the same 145-day period.
- This slower depreciation means the iPhone 17 Pro Max is holding noticeably stronger resale value than the previous generation at the same stage of its lifecycle, helping explain unusually early trade-in activity.
- Around 76.5% of iPhone 17 Pro Max trade-ins are unlocked, suggesting sellers are actively timing resale decisions rather than relying on carrier upgrade programs.
- Around 86% of iPhone 17 Pro Max trade-ins are in Mint or Good condition, suggesting many owners are selling soon after purchase.
Chart analysis
Chart 1 – Growth in iPhone 17 Pro Max trade-ins
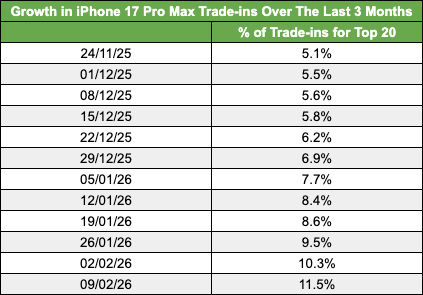
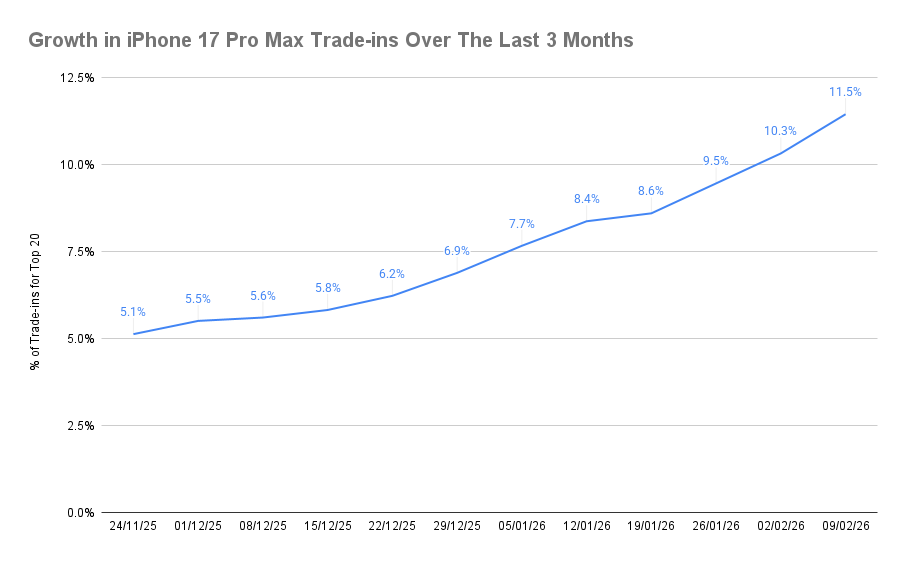
Trade-in share for the iPhone 17 Pro Max rose from around 5.1% in late November to 11.5% by early February, more than doubling in just 12 weeks as the device climbed from eighth position to the number-one spot.
- Share increased steadily week by week rather than spiking suddenly, suggesting sustained resale activity.
- The device moved from outside the top five to number one between late December and mid-January.
- Growth continued into early 2026, indicating ongoing early resale behaviour rather than a short-term promotion or launch spike.
Chart 2 – Top devices for trade-ins
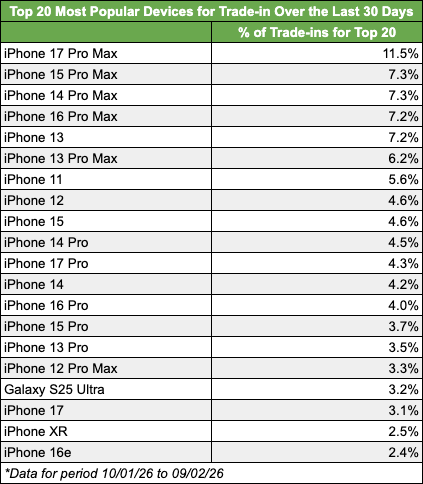
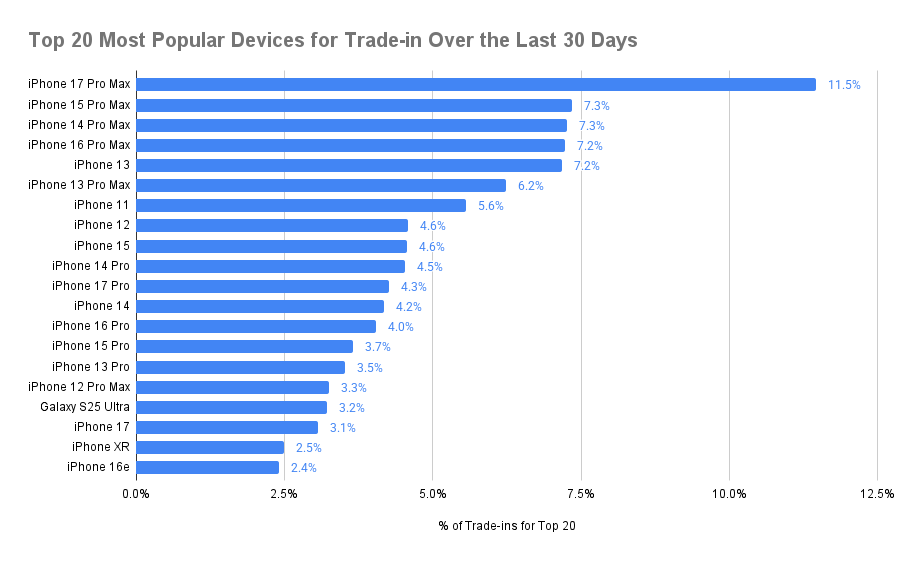
The Top-20 comparison chart highlights how quickly the iPhone 17 Pro Max has moved ahead of competing Pro Max Models.
- The iPhone 15 Pro Max and iPhone 14 Pro Max remain strong but sit several points behind, both at 7.3% respectively.
- Multiple generations appear in the rankings, indicating stable overall resale demand
- A newly released flagship leading the chart is historically unusual.
- Apple devices typically retain stronger resale value than many Android flagships, which can influence trade-in rankings across independent resale markets. Industry studies suggest iPhones often retain around 60–70% of their value after one year compared with roughly 50–60% for Samsung devices, meaning owners are more likely to resell while prices remain high. This difference in depreciation patterns may help explain why iPhone models dominate the Top-20 trade-in rankings.
- The Top-20 most traded-in devices account for roughly 47% of all trade-in activity, showing how heavily resale volume is concentrated among a small group of high-demand models.
Chart 3 – Unlocked vs carrier-locked (combined data)
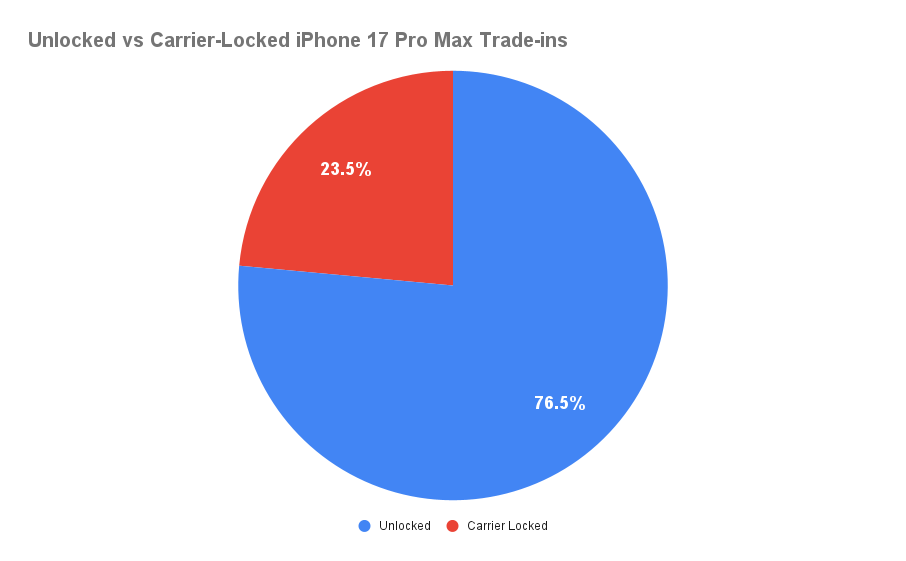
Combined data shows a clear majority of unlocked devices entering the resale market for the iPhone 17 Pro Max.
- 76.5% unlocked versus 23.5% carrier-locked
- Higher unlocked ownership increases resale flexibility
- Data may suggest that sellers are making deliberate timing decisions
Chart 4 – Depreciation comparison
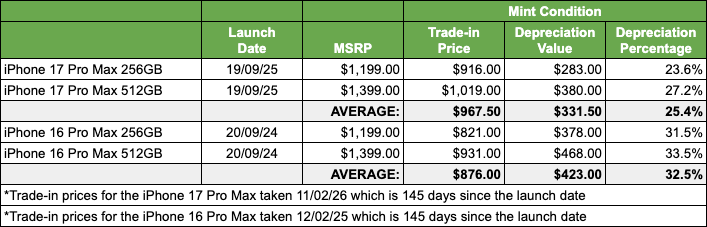
The depreciation comparison highlights stronger value retention for the iPhone 17 Pro Max relative to the previous generation over exactly the same period of time 145 days since launch.
- iPhone 17 Pro Max depreciation averages around 25.4% since launch.
- iPhone 16 Pro Max averaged roughly 32.5% over a similar period.
- This equates to roughly 7% stronger value retention and up to a $95 dollar additional retained value over the same time period for the iPhone 17 Pro Max.
- Stronger pricing performance could help explain early resale behaviour.
Why Owners May Be Selling So Early
Strong resale prices appear to be the biggest driver behind early trade-ins. On average, Mint-condition iPhone 17 Pro Max devices are currently holding significantly more value than the previous generation at the same stage – 7 percent more and up to $95 more per device. With average resale values sitting around $967.50 against original launch prices above $1,200, some owners may see an opportunity to recover a large portion of their spend when they choose to sell iPhone models while prices remain high.
Short ownership cycles can also reduce the overall cost of ownership. Some buyers may simply test the newest flagship before deciding whether to keep it long-term, choosing instead to trade in iPhone 17 Pro Max devices during favourable resale conditions.
However, financial strategy may not be the only explanation. Some users may simply decide that the experience doesn’t justify the price after real-world use. Major software changes, including Apple’s newer design language and evolving iOS features, can influence how a device feels day-to-day, and previous SellCell iOS 26 research has shown that many iPhone owners remain cautious about major software updates.
Economic factors may also play a role. Consumer research from PYMNTS Intelligence suggests that around 71% of Americans report living paycheck to paycheck, while industry studies show that more than half of Americans sold at least one second-hand item last year as resale markets continue to grow. As flagship smartphones now cost well over $1,000, devices like the iPhone 17 Pro Max can act as short-term assets that owners may sell to release cash when needed.
Taken together, early trade-ins may reflect a mix of strong resale value, evolving upgrade habits and broader economic behaviour rather than a single reason.
Depreciation and Resale Performance
One of the most striking findings is how well the iPhone 17 Pro Max is holding its value compared with the previous generation.
- Average depreciation sits around 25.4%
- The iPhone 16 Pro Max saw depreciation closer to 32.5% over a similar period
- Stronger value retention of up to $95 per device vs last year’s iPhone 16 Pro Max, over the same 145 day post launch window, makes early resale financially viable
This performance helps explain why some early adopters may choose to sell sooner rather than later — not because the device has failed, but because resale prices remain unusually strong for a recently launched flagship.
Conclusion
The rapid rise of the iPhone 17 Pro Max as the most traded-in device highlights how smartphone ownership is evolving. Strong value retention and high resale prices appear to be encouraging some owners to sell earlier than usual, treating premium devices more like financial assets than long-term purchases.
At the same time, early trade-ins may also reflect real-world user behaviour — from people testing the latest technology before committing long-term to others choosing to release cash while resale values remain high. Rather than pointing to a single cause, the surge in trade-ins likely reflects a combination of resale strategy, economic timing and changing upgrade habits.
Methodology
This analysis is based on internal SellCell trade-in data and secondary-market pricing trends across 40 independent iPhone buyers. Rankings reflect percentage share of Top-20 devices over time, while depreciation comparisons use average Mint-condition resale values against historical pricing data for previous Pro Max models. Percentages are rounded.
Our content is created in good faith and reviewed regularly - if you spot an error, please contact corrections@sellcell.com. Read our Editorial Policy