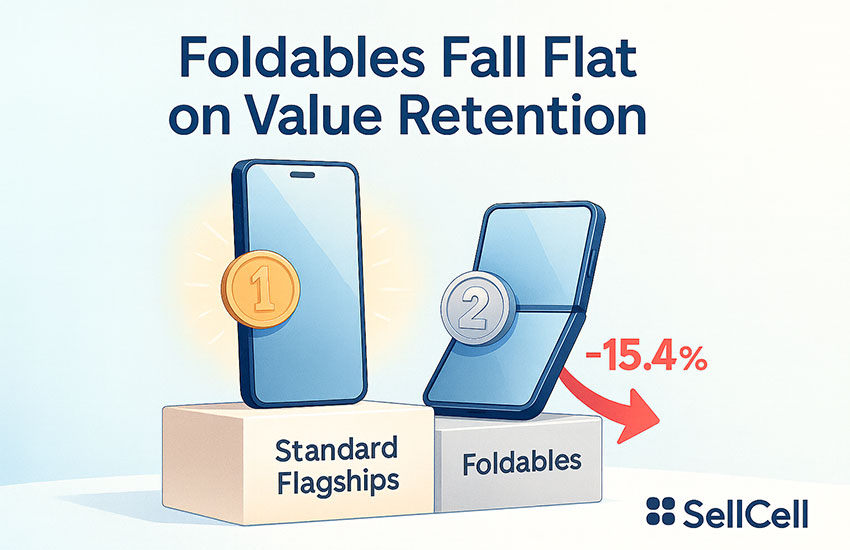
Foldable phones lose up to 15.4% more resale value than standard flagships
Key Findings
- Foldable phones depreciate up to 15.4% more than traditional flagships in the first six months, and around 10.4% more after 18 months.
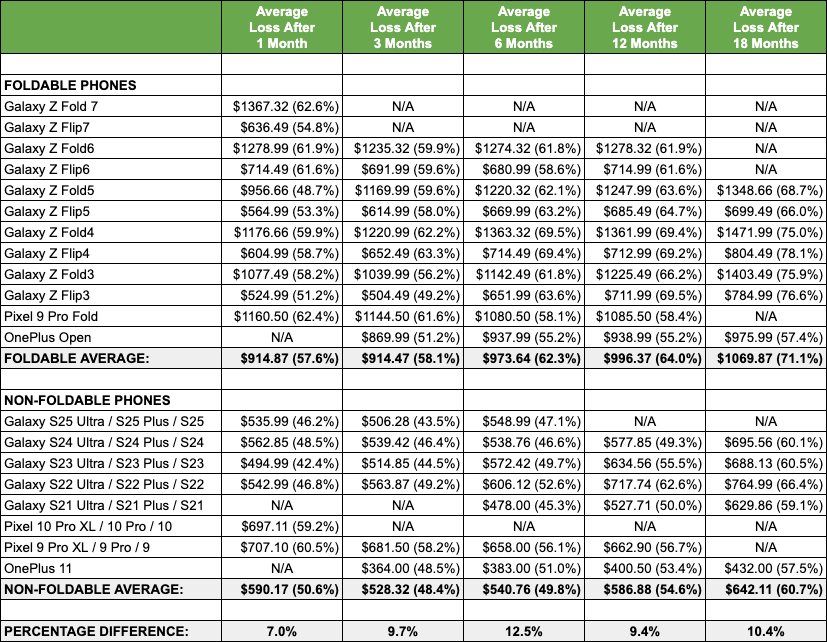
- Samsung’s Z Fold and Flip series show the largest negative gap in value retention, losing 63.7% of their value within six months, compared to 48.3% for the Galaxy S series — a difference of 15.4%.
- Overall, foldable phones lose 62.3% of their value after six months and 71.1% after 18 months, while standard flagship phones lose 49.8% and 60.7%, respectively. This indicates that foldables lose between 10% and 13% more of their value than standard smartphones.
Introduction
Samsung’s new tri-fold phone is expected to make its debut later this year, and reports suggest Apple is also developing its first foldable iPhone. According to Tom’s Guide, Samsung may showcase its tri-fold device at the APEC Summit this fall. Meanwhile, Reuters reports that Apple is exploring test production of its first foldable iPhone in Taiwan, with a possible launch window in 2026.
So, are foldables the next big thing? For some, they offer innovation, flexibility, and feel a little more futuristic but they still don’t retain their value as well as traditional flagship models.
SellCell examined trade-in data from leading foldable and standard flagship phones from brands like Samsung, Google, and OnePlus to compare the two categories and see what the depreciation gap looks like. Let’s see what the data shows in terms of foldable vs non foldable value retention.
Detailed Highlights
- Foldable phones generally depreciate faster than standard flagship models, with a rate that can be as much as 15.4% higher in the first six months after their release.
- On average, foldable devices lose about 62.3% of their value within six months, compared to 49.8% for traditional flagships, highlighting a significant 12.5% difference in short-term value retention.
- After 18 months, foldables have typically lost 71.1% of their value, while non-foldables have seen a depreciation of 60.7%, indicating that foldables tend to lose around 10.4% more in the long run.
- Samsung’s foldable devices experienced the steepest decline, with a value loss of 63.7% in the first six months, compared to 48.3% for the Galaxy S series.
- This 15.4% difference positions Samsung as the brand with the largest gap between foldable and standard models during the initial 18 months.
- In contrast, Google’s Pixel Fold performs better, losing 58.1% after six months, while the Pixel Pro loses 56.1% — a modest 2% difference.
- By the end of the first year, this gap narrows to about 1.7%, indicating that resale stability for Google’s devices improves over time.
- OnePlus shows the smallest difference, with its Open model losing 55.2% in six months, while the OnePlus 11 drops 51.0% — just 4.2% worse.
- After 18 months, the value retention of the OnePlus Open and OnePlus 11 is nearly the same, making the Open the best-performing foldable in this analysis.
- Samsung’s Z Fold and Flip series consistently rank as the weakest in terms of value retention, with depreciation rates surpassing the market average across all timeframes.
Data Overview
Foldables vs Standard Flagships – Overall Comparison
- Across all brands, foldable phones depreciate significantly faster than standard flagships.
- At the six-month mark, foldables had lost an average of 62.3% of their value, compared with 49.8% for non-foldables — a difference of roughly 12.5%.
- By 18 months, foldables had dropped 71.1% compared with 60.7% for standard models, maintaining a consistent 10.4% gap.
This steady difference shows that foldables continue to underperform across their lifespan, suggesting consumers still view them as riskier long-term purchases.
Samsung – Foldables vs Galaxy S
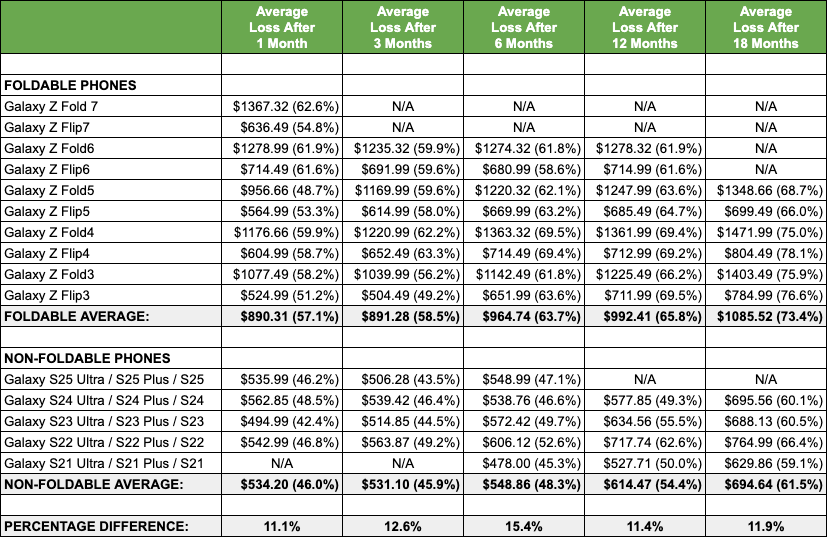
- Samsung’s Z Fold and Z Flip models show the sharpest early depreciation of any brand analyzed.
- After six months, Samsung foldables had lost 63.7% of their value, while the Galaxy S series had lost just 48.3% — a 15.4% difference in value retention.
- After a year, foldables were still down 65.8% against 54.4% for the Galaxy S, showing the same pattern and a 11.4% value retention gap.
The data highlights how Samsung’s dominance in the foldable category doesn’t yet translate to stronger resale confidence.
Google – Pixel Fold vs Pixel Pro
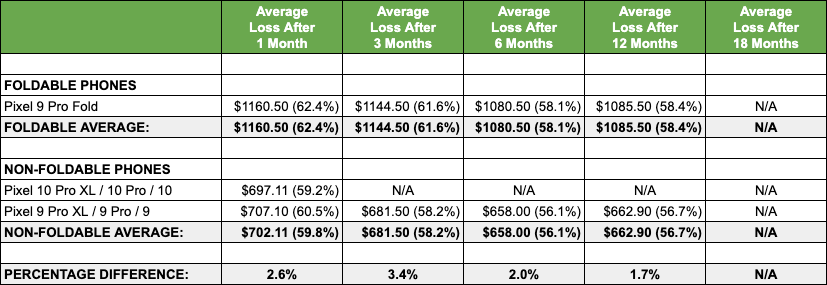
- Google’s Pixel Fold loses value more gradually than Samsung’s foldables but still underperforms the Pixel Pro.
- At six months, depreciation for the Pixel Fold reached 58.1%, compared with 56.1% for the Pixel Pro — a difference of around 2%.
- After 12 months, the gap narrowed slightly to 1.7%, suggesting that Google’s foldables might be closer to bridging the resale gap as the line matures.
OnePlus – Open vs OnePlus 11
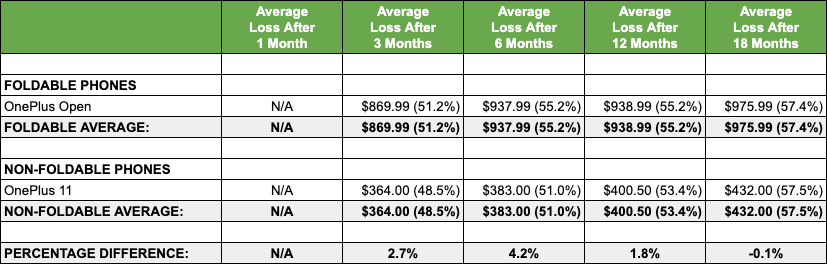
- The OnePlus Open starts off slightly behind the OnePlus 11 but closes the gap over time.
- After six months, depreciation was 55.2% for the Open and 51.0% for the OnePlus 11 — a 4.2% difference.
- By 18 months, both phones had depreciated almost identically, showing that smaller, competitively priced brands may be finding ways to stabilize value faster.
Summary
There are quite a few reasons why foldable phones might depreciate more quickly than standards. The foldable trend is fairly new to the market and as such resellers and buyers still view them as intriguing yet untested, whereas users are more familiar with a standard phone. Repairing or replacing foldable screens is significantly pricier than dealing with standard displays / screens, making second-hand models less attractive for trade-ins or resale.
Currently, traditional smartphones are the more reliable choice for both consumers and resellers. They are simpler to refurbish, have more predictable resale values, and enjoy a well-established demand. While foldables may represent the future of technology, they are still in the early-adopter stage regarding value retention.
It will be interesting to see how the latest foldable models perform, especially with Apple’s entry into the market and Samsung’s innovative tri-fold design Will these advancements help them compete more closely with conventional flagship devices on the depreciation front?
Methodology
SellCell analyzed trade-in value data for leading foldable and non-foldable flagship smartphones from Samsung, Google, and OnePlus. Depreciation was tracked over 1, 3, 6, 12, and 18-month periods, based on the top resale prices across 40+ verified US buyback companies.
Our content is created in good faith and reviewed regularly - if you spot an error, please contact corrections@sellcell.com. Read our Editorial Policy