But Android Users Are More Likely to Switch Than iPhone Users (13.6% vs 3.6%)
“Smartphone users are becoming increasingly locked into their chosen brand, with loyalty rising across both iPhone and Android and switching now at its lowest levels.”
Key Findings
- iPhone loyalty stands at 96.4%, up from 91.9% in 2021
- Android loyalty stands at 86.4%, with users nearly four times more likely to switch than iPhone users (13.6% vs 3.6%)
- Samsung loyalty has risen to 90.1%, up from 74% in 2021
- Google loyalty has rebounded to 86.8%, up from 65.2% in 2021
- Price and value remain the biggest drivers of switching
Introduction
Brand loyalty in the smartphone market has long been dominated by Apple, but how does that loyalty look in 2026?
To find out, SellCell surveyed over 5,000 smartphone users across iPhone and Android phones in the USA, exploring whether users plan to stay with their current brand, what drives those decisions, and where switchers are heading next.
Compared to our previous Phone Brand Loyalty Surveys in 2021 and 2019, the latest data shows a clear shift: loyalty has increased across the board, while switching has declined.
Main Statistical Findings
- iPhone loyalty stands at 96.4%, up from 91.9% in 2021
- iPhone switching stands at 3.6%
- Android loyalty stands at 86.4%, with switching at 13.6%
- Android users are nearly four times more likely to switch than iPhone users
- Samsung loyalty stands at 90.1%, up from 74% in 2021
- Samsung switching stands at 9.9%
- Google loyalty stands at 86.8%, up from 65.2% in 2021
- Google switching stands at 13.2%
- The loyalty gap between iPhone and Android now stands at 10 percentage points
- Price and value are the biggest drivers of switching
- Technology is the second biggest driver
- Overall, loyalty has increased across all major brands since 2021
Brand Loyalty Over Time (2019–2026)
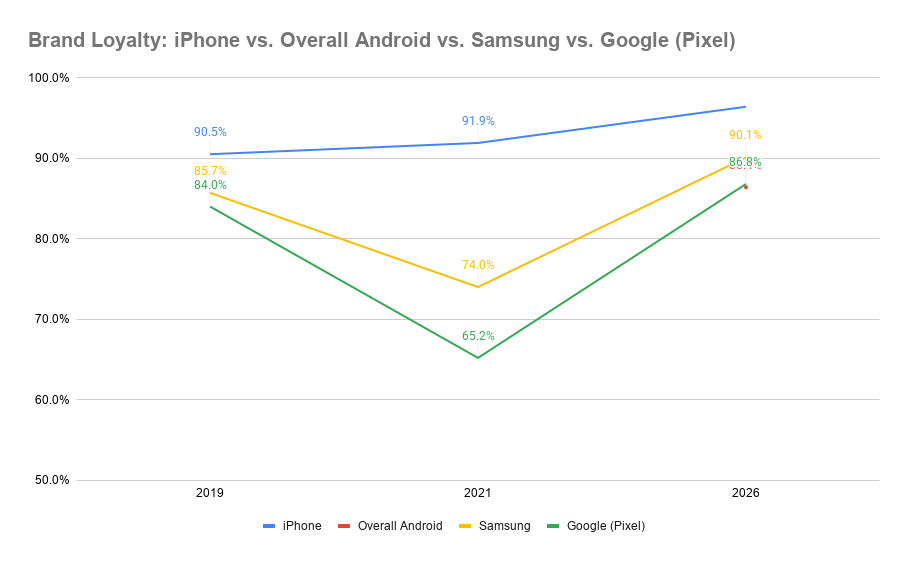
| 2019 | 2021 | 2026 | |
| iPhone Brand Loyalty | 90.5% | 91.9% | 96.4% |
| iPhone Switching | 9.5% | 8.1% | 3.6% |
| Overall Android Brand Loyalty | – | – | 86.4% |
| Overall Android Switching | – | – | 13.6% |
| Samsung Brand Loyalty | 85.7% | 74.0% | 90.1% |
| Samsung Switching | 14.3% | 26.0% | 9.9% |
| Google Brand Loyalty | 84.0% | 65.2% | 86.8% |
| Google Switching | 16.0% | 34.8% | 13.2% |
- iPhone loyalty has increased from 90.5% in 2019 to 91.9% in 2021, and now 96.4% in 2026
- Samsung loyalty fell from 85.7% in 2019 to 74.0% in 2021, before recovering to 90.1% in 2026
- Google followed a similar pattern, dropping from 84.0% in 2019 to 65.2% in 2021, then rebounding to 86.8% in 2026
- The data shows a clear dip in loyalty across Android brands in 2021, followed by a strong recovery in 2026
- Apple, by contrast, has shown consistent growth across all three studies
- Overall, loyalty is now at its highest recorded level across all major brands, with the market becoming more stable over time.
Data & Analysis
Chart 1 – iPhone: When you next upgrade your phone, what will you most likely do?
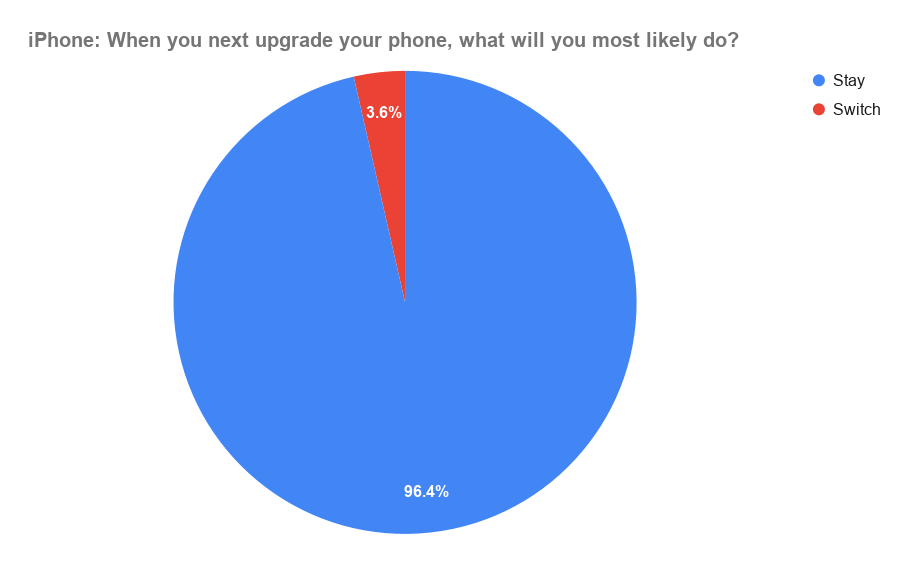
| iPhone | |
| Stay | 96.4% |
| Switch | 3.6% |
- 96.4% of iPhone users say they will stay
- 3.6% say they will switch
- This represents an increase from 91.9% loyalty in 2021, showing continued strengthening of Apple’s user base
- Switching has fallen to extremely low levels, with fewer than 1 in 25 users considering leaving
- Apple now has one of the most stable user bases across all major smartphone brands
Chart 2 – Android: When you next upgrade your phone, what will you most likely do?
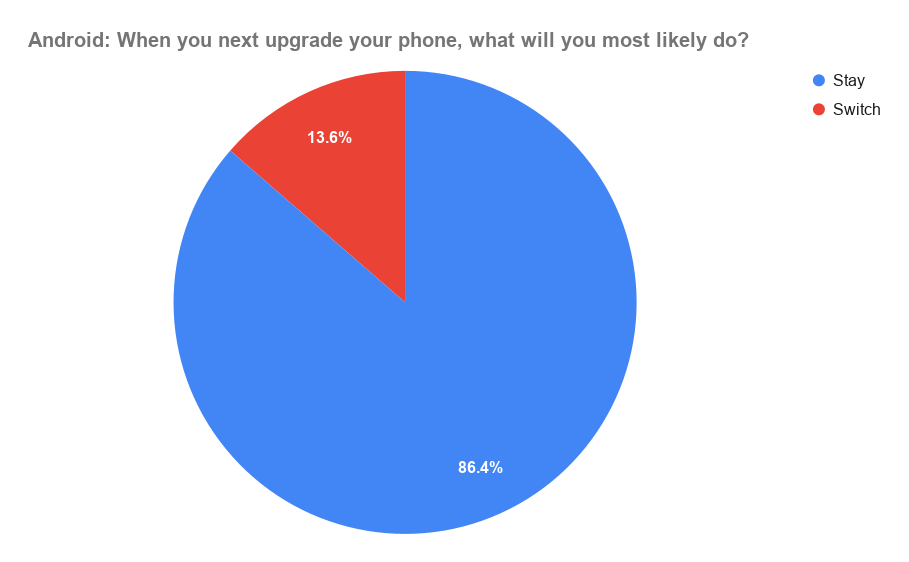
| Android | |
| Stay | 86.4% |
| Switch | 13.6% |
- 86.4% of Android users say they will stay
- 13.6% say they will switch
- This means Android users are nearly 4x more likely to switch than iPhone users
- Despite this, loyalty is strong overall, though switching remains significantly higher than for iPhone users
- Android remains more fluid, but still shows strong overall retention
Chart 3 – Samsung: When you next upgrade your phone, what will you most likely do?
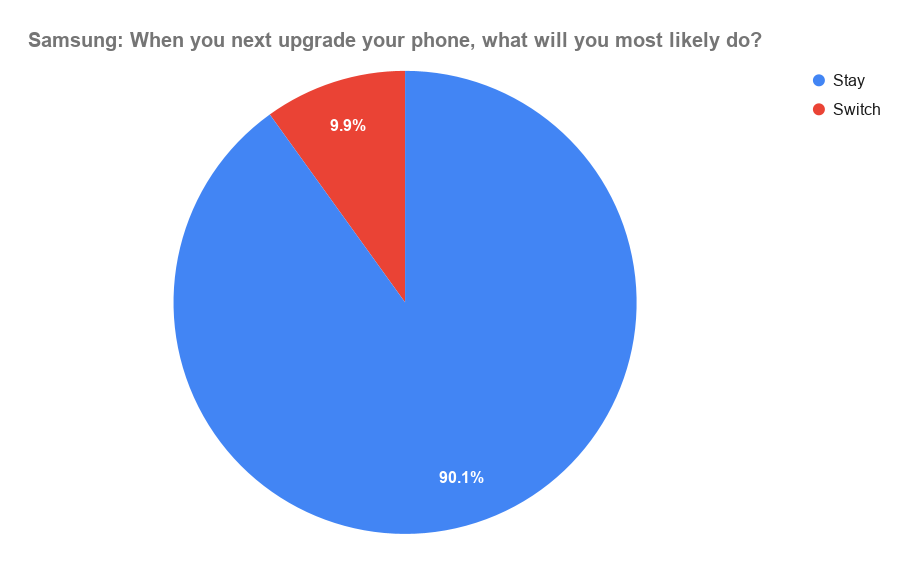
| Samsung | |
| Stay | 90.1% |
| Switch | 9.9% |
- 90.1% of Samsung users say they will stay
- 9.9% say they will switch
- This is a significant increase from 74% loyalty in 2021 (+16.1 percentage points)
- Samsung has reduced switching by a meaningful margin
- Samsung now sits between Apple and the broader Android average in terms of loyalty
Chart 4 – Google: When you next upgrade your phone, what will you most likely do?

| Stay | 86.8% |
| Switch | 13.2% |
- 86.8% of Google users say they will stay
- 13.2% say they will switch
- This is a strong recovery from 65.2% in 2021 (+21.6 percentage points)
- Despite this, switching remains relatively high
- Google has improved significantly, but still lacks the retention strength of Apple or Samsung
Chart 5 – iPhone: If you were to switch, which brand would you choose?
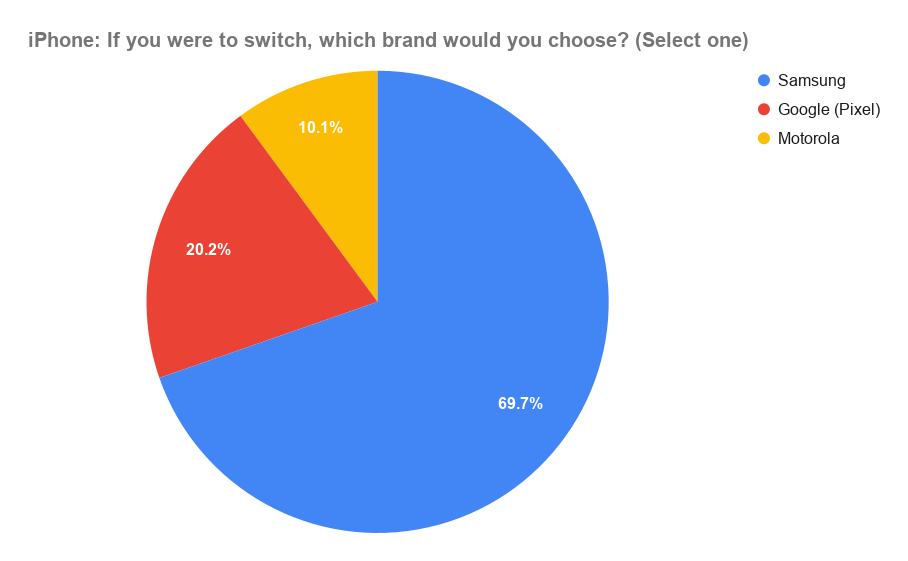
| iPhone | |
| Samsung | 69.7% |
| Google (Pixel) | 20.2% |
| Motorola | 10.1% |
| Xiaomi | 0.0% |
| OnePlus | 0.0% |
- 69.7% of iPhone switchers choose Samsung
- 20.2% choose Google Pixel
- 10.1% choose Motorola
- Even as iPhone loyalty has increased since 2021, Samsung remains the dominant alternative
- Switching remains rare and concentrated among a small number of brands
Chart 6 – Android: If you were to switch, which brand would you choose?
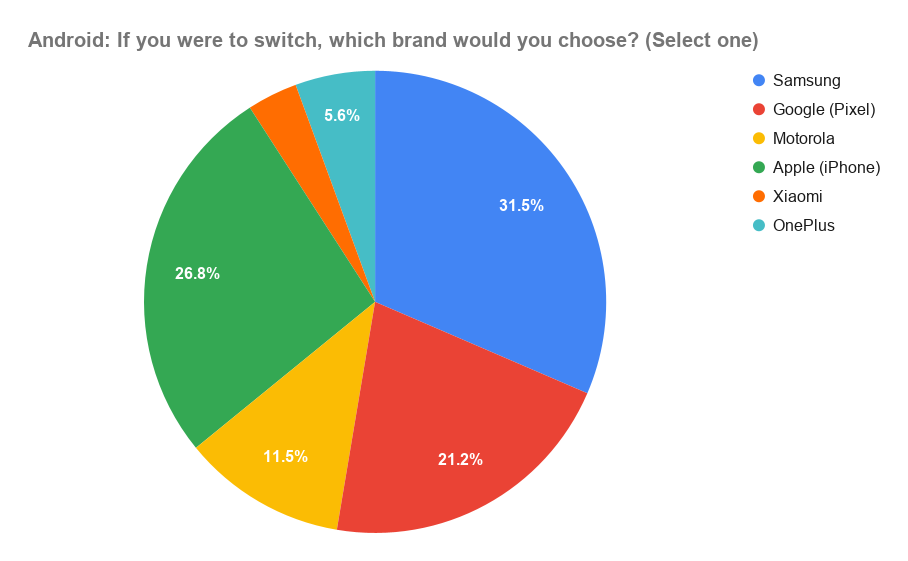
| Android | |
| Samsung | 31.5% |
| Google (Pixel) | 21.2% |
| Motorola | 11.5% |
| Apple (iPhone) | 26.8% |
| Xiaomi | 3.5% |
| OnePlus | 5.6% |
- 31.5% choose Samsung
- 26.8% choose iPhone
- 21.2% choose Google Pixel
- 11.5% choose Motorola
- Android users remain more evenly distributed across brands
- Apple captures more than 1 in 4 switchers, highlighting continued cross-ecosystem movement
- This aligns with Android’s lower overall loyalty compared to Apple
Chart 7 – iPhone: Why would you stay?
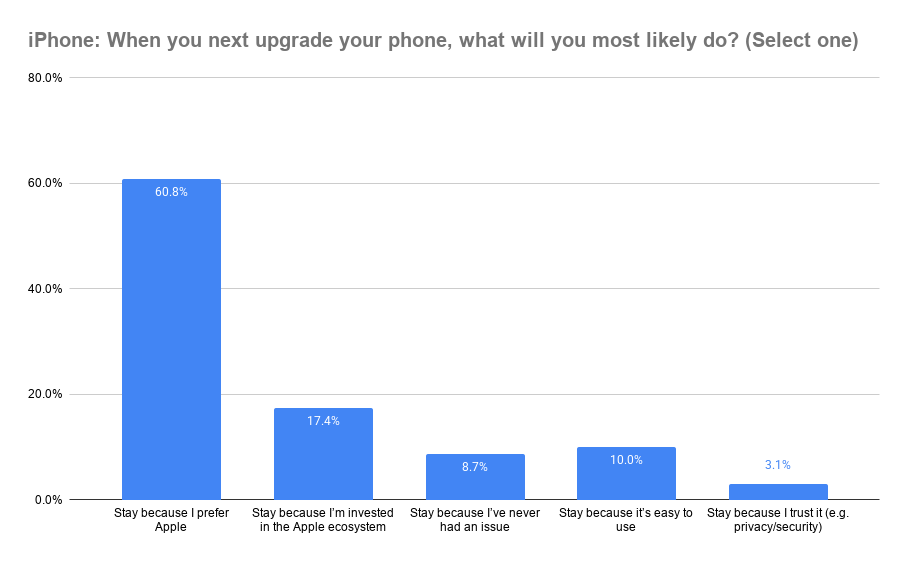
| iPhone | |
| Stay because I prefer Apple | 60.8% |
| Stay because I’m invested in the Apple ecosystem | 17.4% |
| Stay because I’ve never had an issue | 8.7% |
| Stay because it’s easy to use | 10.0% |
| Stay because I trust it. (e.g. privacy/security) | 3.1% |
- 60.8% cite brand preference
- 17.4% cite ecosystem
- 10.0% cite ease of use
- 8.7% cite reliability
- 3.1% cite trust
- Brand and ecosystem account for 78.2% of reasons for staying
- The increase in loyalty since 2021 suggests ecosystem lock-in is strengthening further.
Chart 8 – Android: Why would you stay?
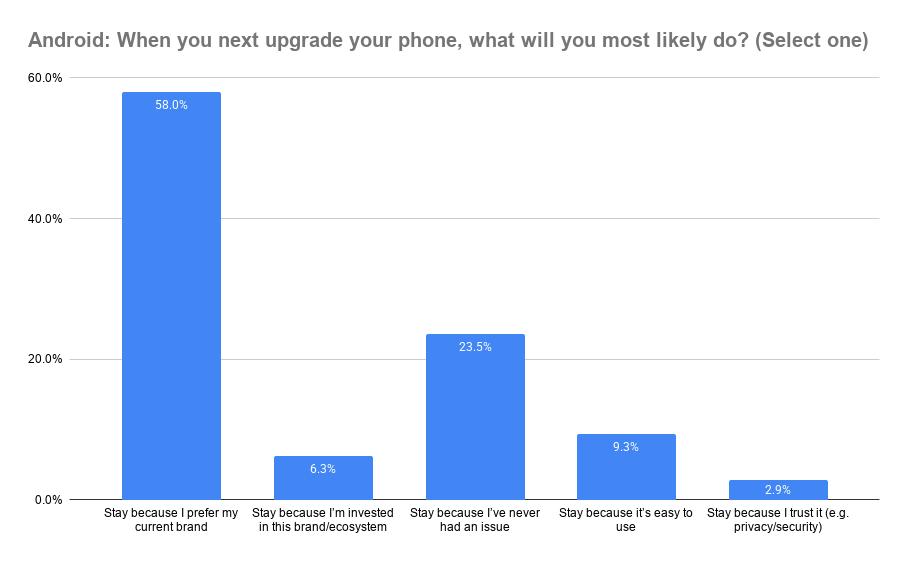
| Android | |
| Stay because I prefer my current brand | 58.0% |
| Stay because I’m invested in this brand/ecosystem | 6.3% |
| Stay because I’ve never had an issue | 23.5% |
| Stay because it’s easy to use | 9.3% |
| Stay because I trust it (e.g. privacy/security) | 2.9% |
- 58.0% cite brand preference
- 23.5% cite reliability
- 9.3% cite ease of use
- 6.3% cite ecosystem
- 2.9% cite trust
- Brand and reliability account for 81.5% of responses
Chart 9 – iPhone: Why would you switch?
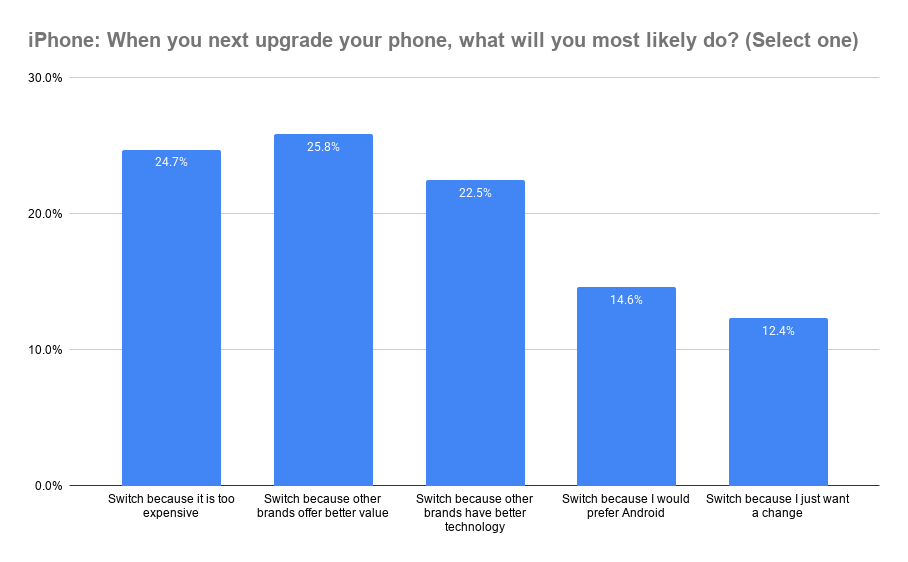
| iPhone | |
| Switch because it is too expensive | 24.7% |
| Switch because other brands offer better value | 25.8% |
| Switch because other brands have better technology | 22.5% |
| Switch because I would prefer Android | 14.6% |
| Switch because I just want a change | 12.4% |
- 25.8% cite better value
- 24.7% say iPhones are too expensive
- 22.5% cite better technology
- 14.6% prefer Android
- 12.4% want a change
- Price and value account for over 50% of switching reasons
- Compared to 2021, cost appears to play a more prominent role in switching decisions
Chart 10 – Android: Why would you switch?
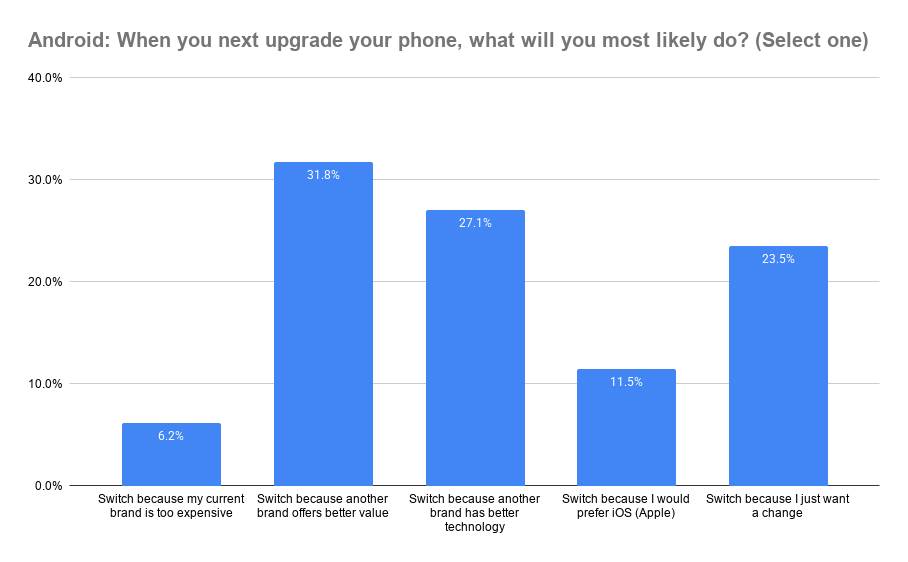
| Android | |
| Switch because my current brand is too expensive | 6.2% |
| Switch because another brand offers better value | 31.8% |
| Switch because another brand has better technology | 27.1% |
| Switch because I would prefer iOS (Apple) | 11.5% |
| Switch because I just want a change | 23.5% |
- 31.8% cite better value
- 27.1% cite better technology
- 23.5% want a change
- 11.5% want iOS
- 6.2% cite price issues
- Value and technology account for 58.9% of switching reasons
- More than 1 in 10 users explicitly want to move to Apple
- Compared to 2021, switching appears more driven by value than purely technology
Chart 11 – How long have you been using your current smartphone brand?
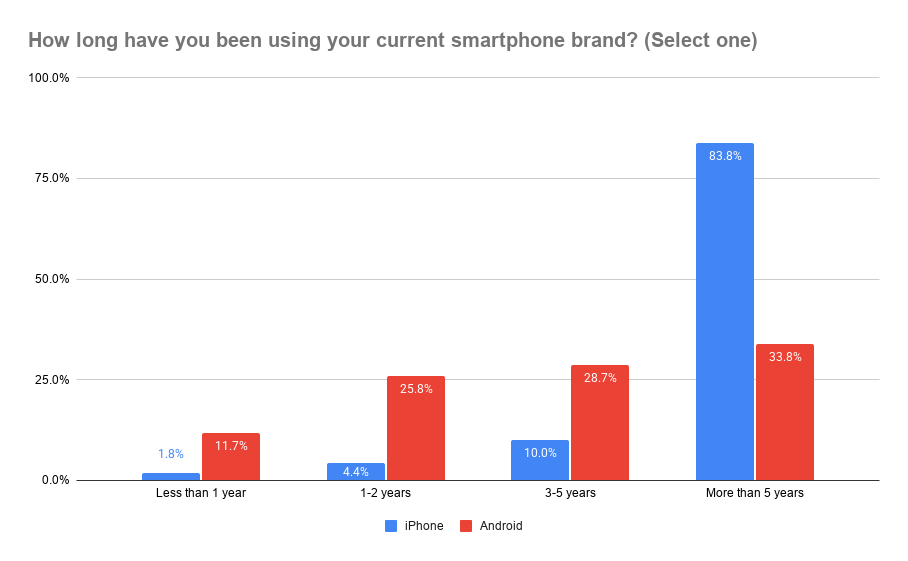
| iPhone | Android | |
| Less than 1 year | 1.8% | 11.7% |
| 1-2 years | 4.4% | 25.8% |
| 3-5 years | 10.0% | 28.7% |
| More than 5 years | 83.8% | 33.8% |
- 83.8% of iPhone users have stayed for more than 5 years
- Only 33.8% of Android users have done the same
- iPhone users are nearly 2.5x more likely to be long-term users
- This helps explain why Apple loyalty has increased further since 2021
Chart 12 – Switching likelihood based on when people plan to upgrade
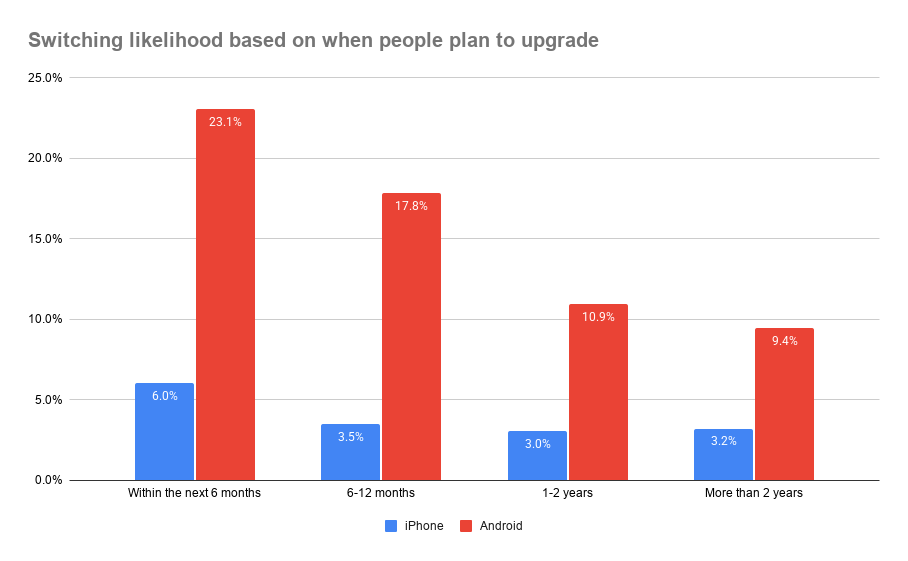
| iPhone | Android | |
| Within the next 6 months | 6.0% | 23.1% |
| 6-12 months | 3.5% | 17.8% |
| 1-2 years | 3.0% | 10.9% |
| More than 2 years | 3.2% | 9.4% |
- 23.1% of Android users upgrading within 6 months plan to switch
- This falls to 17.8%, 10.9%, and 9.4% over longer timeframes
- iPhone switching remains between 3–6% across all groups
- Compared to 2021, overall switching is lower, but upgrade timing remains the key trigger
Conclusion
iPhone loyalty now stands at 96.4%, up from 90.5% in 2019 and 91.9% in 2021 (+5.9 percentage points since 2019), while switching has fallen to just 3.6%, down from 9.5% in 2019.
The loyalty gap between iPhone and Android now stands at 10 percentage points (96.4% vs 86.4%), underlining the strength of Apple’s user retention.
Samsung has seen a strong recovery, with loyalty rising to 90.1% in 2026, up from 74% in 2021 and slightly above its 85.7% level in 2019, marking a full rebound and improvement over time.
Google has also recovered significantly, increasing from 65.2% in 2021 to 86.8%, slightly above its 2019 level (84.0%).
Despite these gains, Android users remain nearly four times more likely to switch than iPhone users (13.6% vs 3.6%), maintaining a clear gap in loyalty between the two ecosystems.
This is reinforced by long-term behaviour. 83.8% of iPhone users have been with Apple for more than 5 years, compared to just 33.8% of Android users, highlighting a far more deeply embedded and stable user base.
Looking across all three studies, the trend is clear. Loyalty dipped for Android brands in 2021, but has since rebounded, while Apple has continued to strengthen its already dominant position. At the same time, switching has declined across the market.
In simple terms, users are becoming increasingly locked into their chosen ecosystem. If a user is on iPhone, they are now even more likely to stay there than before — and the same trend is increasingly visible across Android brands.
As a result, the opportunity to win users from competitors appears to be narrowing. Instead, growth is increasingly dependent on attracting new users into each ecosystem, rather than winning them from competitors, particularly through lower-cost and entry-level devices.
Overall, the smartphone market is becoming more stable than in both 2019 and 2021, with stronger brand attachment and less frequent switching than ever before.
Methodology
The survey included over 5,000 respondents, with approximately equal representation between iPhone and Android users, in the USA (age 18+). This included a substantial sample of Samsung and Google users within the Android group, enabling reliable brand-level analysis. Responses were also segmented between those intending to stay with their current brand and those considering switching.
Participants were asked about their current smartphone brand, how long they have used it, whether they plan to stay or switch when they next upgrade, their reasons for doing so, and which brand they would choose if switching.
Two separate surveys were conducted for iPhone and Android users, with consistent question structures to allow direct comparison across ecosystems and against our previous brand loyalty studies in 2021 and 2019.
All respondents were shown the same question structure. Analysis was conducted post-survey to separate users based on whether they intended to stay or switch.
The 2026 results are directly compared to our previous studies to track changes in brand loyalty, switching behaviour, and consumer decision drivers over time.
Our content is created in good faith and reviewed regularly - if you spot an error, please contact corrections@sellcell.com. Read our Editorial Policy