Expert data reveals Apple’s resale values slipping range-on-range, while Samsung and Google’s AI flagship smartphones gain ground
Recent data from SellCell highlights an important shift in smartphone resale dynamics. Although Apple’s iPhone remains the leader, Samsung’s AI-enhanced Galaxy S series is consistently closing the gap year over year. If these trends continue, the resale value gap could narrow significantly by 2026, though upcoming flagship launches may influence the pace of change.
Key Findings
- At 5 months post-launch, the iPhone 16 has lost 35.4% of its value, up from 24.7% for the iPhone 13 — a notable 10.7 percentage point increase in depreciation across four generations. Quite a jump!
- The Galaxy S25’s depreciation improved to 46.6%, down from 51.9% for the S22, showing a 5.3 percentage point improvement that suggests stronger resale value retention.
- The Pixel 9 lost 2.6 percentage points less value at 10 months compared to the Pixel 8, hinting at growing consumer confidence in Google’s AI integration.
- iPhone 16 depreciated faster than the iPhone 15, indicating that AI provides no boost to resale value — at least for now!
- If current trends continue, Samsung may significantly reduce the resale value gap with Apple by mid-2026.
For consumers choosing their next smartphone, these shifting resale values could influence buying decisions in surprising ways. Imagine opting for a Samsung device that not only offers top-tier AI features but might also hold its value nearly as well as an iPhone within a couple of years.
Introduction
SellCell has long reported that the Apple iPhone leads the pack in producing phones that depreciate more slowly than competitors, making it the undisputed champion of resale value retention. But with the introduction and rollout of Apple Intelligence and Samsung’s Galaxy AI, are our data experts still seeing the same story in the independent resale marketplace?
This article dives into whether AI-enabled smartphones are helping brands hold their value or speeding up depreciation. By analysing resale trends across five generations of flagship devices from Apple, Samsung, and Google within the independent buyback market, SellCell reveals which brands are gaining ground, which are losing it, and how artificial intelligence is reshaping the second-hand market.
Building on data from our recent AI smartphone survey, we also explore whether new AI features are challenging the well established fact that Apple has always been the slowest phone depreciator. Interestingly, could Samsung eventually overtake Apple’s long-standing dominance as the King of Smartphone Value Retention? It’s a question worth considering. What does this mean for the broader smartphone market—and for you as a buyer? Let’s dive into the numbers.
Our depreciation data looks into three main questions:
- How are depreciation trends changing across flagship generations?
- Is AI having a real impact on resale value?
- Which brands lead resale value now, and will Apple continue to dominate as King of Value Retention?
Looking at resale data from the iPhone 16, Galaxy S25, Pixel 9 and previous models helps us answer these.
Detailed Highlights
- iPhone depreciation worsened by 10.7 percentage points at 5 months post-launch, rising from 24.7% (iPhone 13) to 35.4% (iPhone 16).
- Samsung’s Galaxy S series improved by 5.3 percentage points in month 5, dropping from 51.9% (S22) to 46.6% (S25), continuing a steady upward trend.
- At 9 months, iPhone depreciation climbed from 25.2% (iPhone 12) to 34.7% (iPhone 16), showing that Apple’s AI hasn’t reversed the trend – yet!
- Galaxy S25’s 5-month depreciation of 46.6% is a slight 0.7-percentage point improvement over the S24 and 3.4 points better than the S23 at the same stage.
- While Apple still leads in resale value, the gap is narrowing, there’s now an 11.2-point difference at 5 months between Galaxy S25 and iPhone 16.
- Pixel 9 showed a 2.6-point year-on-year improvement at 10 months over Pixel 8, suggesting growing trust in Google’s AI-first flagship.
- Samsung’s Foldables surprised by depreciating 2.4 points less than the previous generation at 9 months, beating expectations.
- If depreciation trends continue to track in the same way, there is a strong possibility that Samsung’s Galaxy S series could possibly overtake Apple’s resale value by mid 2026 — a big shift in second-hand market leadership.
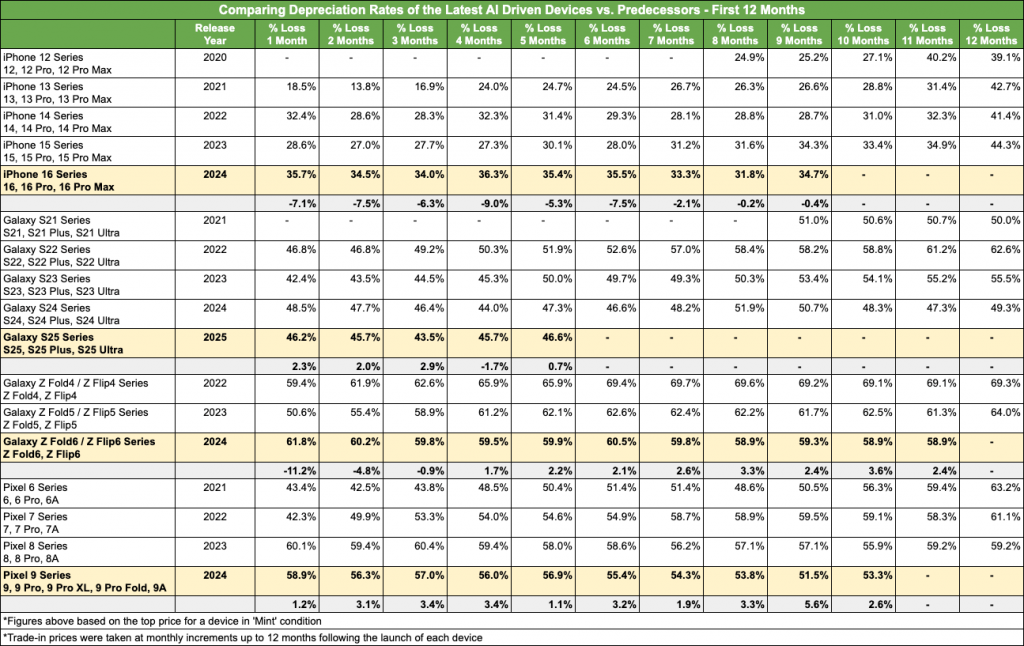
Comparing Depreciation Rates of the Latest AI Driven Devices vs. Predecessors – First 12 Months
The table looks at ‘range on range’ depreciation over the past 5 years, highlighting changes year on year between each launch over the months ahead.


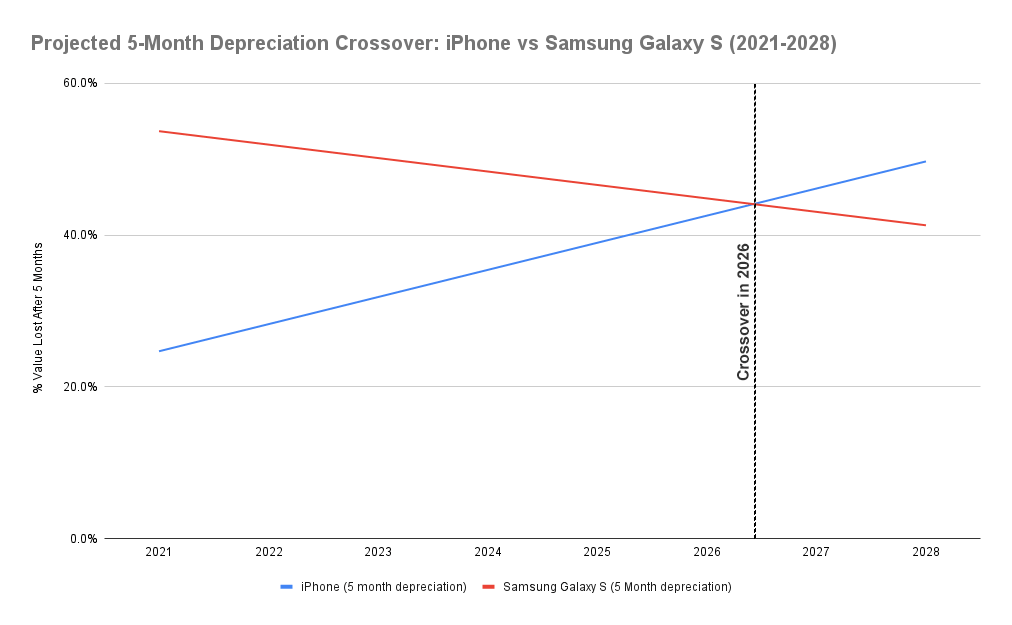
Projected Depreciation for Apple & Samsung
Depreciation Data – Month 5 Post Launch
The graph below shows the projected resale depreciation of Apple iPhones and Samsung Galaxy S phones five months after launch, based on data from 2021 to 2025.
While iPhone depreciation has steadily increased between ranges, Samsung’s Galaxy S series has been improving. The two lines cross around mid 2026, which means Samsung is expected to start holding its resale value better than Apple from then on
Note that this is at the 5th month of depreciation and to get a longer term view we will also look at a 9 month forecast.
- iPhone depreciation rose 10.7 percentage points from 24.7% in 2021 to 35.4% in 2024.
- Samsung’s Galaxy S depreciation improved by 5.3 percentage points, falling from 51.9% in 2022 to 46.6% in 2025.
- We averaged the annual change for each brand — Apple’s depreciation increases by about 3.57 percentage points per year, while Samsung’s decreases by about 1.77 points per year
- Extrapolating these trends forward, the crossover for Samsung Phones to meet iPhone’s average retained value is projected for mid 2026.
5-Month Depreciation Analysis:
We used iPhone resale data from 2021 to 2024, showing depreciation rising from 24.7% to 35.4%. For Samsung, we used data from 2022 to 2025, with depreciation improving from 51.9% to 46.6%. The average annual change (run rate) was calculated by subtracting the earliest depreciation from the latest, then dividing by the years between, resulting in +3.57 percentage points per year for iPhone and –1.77 for Samsung. These run rates were used to project future depreciation trends.
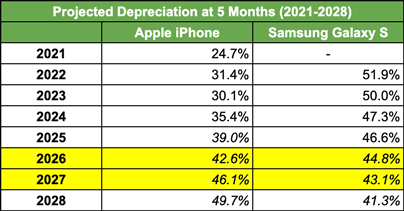
- The iPhone resale value is slipping faster, expected to lose 46.1% of its value by 2027 if current trends continue.
- Samsung’s resale value is steadily improving, forecasted to drop to 43.1% depreciation by 2027.
- The mid 2026 crossover marks a major shift in the resale smartphone market, driven by Samsung’s gains.
Depreciation Data – Month 9 Post Launch
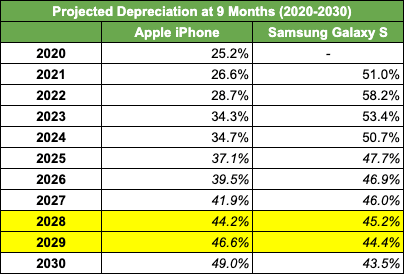
To apply a little more longevity to a depreciation projection we have also looked at 9 months worth of data post the launch of a range. Because Samsung’s Galaxy S25 only launched in February 2025, we don’t have actual 9-month depreciation data yet. So, we modeled the S25 based on Samsung’s recent performance and AI upgrades. For context here’s what we based our projection on:
- Galaxy S22 lost 58.2% of its value in 9 months.
- Galaxy S23 improved to 53.4%.
- Galaxy S24 further improved to 50.7%.
- Galaxy S25 predicted to depreciate by 47.7% at 9 months
The 2025 9-month depreciation figure for the Samsung Galaxy S25, estimated at 47.7%, was calculated by analyzing the year-on-year improvement between the 2023 Galaxy S23 (53.4%) and the 2024 Galaxy S24 (50.7%), which showed a decline of 2.7 percentage points. To be conservative and account for potential variability, this decline was rounded to 3 percentage points and subtracted from the 2024 figure to project the S25’s depreciation. This modeled value provides a realistic estimate of continued improvement in Samsung’s resale value retention.
This projection is based on trends, not actual data, but fits the pattern of steady improvement.
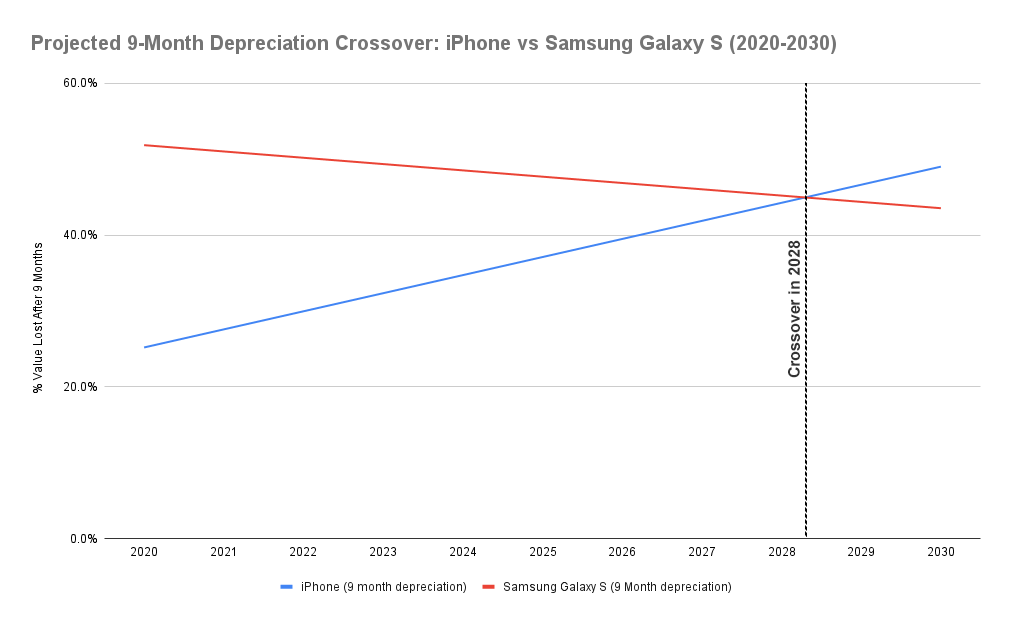
9-Month Depreciation Analysis:
We used iPhone data from 2020 to 2024, with depreciation increasing from 25.2% to 34.7%. Samsung data spanned 2021 to 2025 (modeled for 2025), with depreciation improving from 51.0% to 47.7%. Using the same method, run rates were +2.38 percentage points per year for iPhone and –0.83 for Samsung. These informed the linear projections estimating when Samsung’s resale value will match Apple’s in 2028.
Realistic Prediction on Crossover Timing
SellCell’s data reveals a consistent increase in iPhone depreciation over recent years, while Samsung’s Galaxy S series displays steady improvements in resale value retention. Although Apple maintains a lead, the gap is shrinking. Projections indicate that, if these trends hold, Samsung’s Galaxy S series could close the difference substantially by 2026, though the exact crossover point will depend on market fluctuations.
While the 5-month data suggests the crossover could happen as early as mid-2026, the 9-month modeled data indicates it might occur closer to early 2028. Given limitations in the data and potential market changes, the actual crossover is likely to fall somewhere between these dates—assuming current trends continue without disruption. However, if Apple introduces impactful changes with the iPhone 17, it could slow or even reverse the current depreciation trend. All projections depend on steady market conditions; unexpected shifts in technology, consumer preferences, or product strategies could alter these outcomes.
Apple Still Leads, but Android Is Closing Fast
Even though the iPhone 16 has depreciated 35.4% after 5 months, Apple still holds the resale value crown — for now. At the same point in their lifecycle, the Galaxy S25 is down 46.6% after 5 months, showing that while Apple leads in absolute terms, the margin is shrinking. We explored this pattern of change in Is the iPhone Still King of Value Retention and also showed early signs that Samsung then were catching up if we looked at depreciation range by range.
Apple Intelligence, while impressive, hasn’t yet boosted iPhone resale values—likely due to its phased rollout and early consumer caution around the iPhone 16. Meanwhile, Samsung’s Galaxy Intelligence packs real, everyday AI tools like Live Translate and Generative Edit, backed by longer update promises.
This practical approach seems to be winning consumer trust and helping Samsung devices hold value better in the resale market.
Conclusion
Apple’s iPhone continues to dominate resale value retention, but depreciation has increased with recent models. Samsung’s Galaxy S series and Google’s Pixel phones show encouraging improvements, reflecting growing consumer trust in Android’s AI integration. While Samsung is not projected to overtake Apple imminently, the resale value gap is closing, with mid-2026 marking a possible milestone if current trends persist. Future Apple device launches and market developments could influence these patterns.
Let’s hope the iPhone 17’s rumored hardware and storage improvements can help halt the resale gap. After nearly a decade of the SellCell team tracking depreciation and highlighting Apple’s reign as the clear champion of value retention, it would be both surprising and a little bittersweet to see that dominance challenged, but also exhilarating to witness a new contender enter the ring and battle it out. As someone who’s tracked smartphone trends for years, I find it fascinating—and a bit thrilling—to watch this rivalry heat up. The resale battle between Apple and Samsung is shaping up to be one of the most compelling stories in tech today.
Apple’s upcoming iPhone 17 and future AI advancements could yet change the picture. SellCell will keep tracking these developments closely as new data arrives.
Methodology
SellCell aggregates resale pricing data from over 40 major U.S. buyback platforms. Our analysis focuses exclusively on mint-condition devices, tracking their resale values over time compared to original MSRP. All prices reflect independent market offers paid in cash, without involvement in manufacturer or carrier trade-in programs, upgrade requirements, or bundled promotions. Unlike trade-in systems that often require users to remain within a specific brand or carrier ecosystem, SellCell’s data reflects true open-market resale values. This approach provides an unbiased, transparent view of how smartphones hold their value in the independent second-hand market.
All data is current as of July 2025. No personal information is collected during this analysis. SellCell is not affiliated with Apple, Samsung, or Google.
How We Calculated the Projection
We analyzed resale depreciation percentages for iPhones and Samsung Galaxy S phones at 5 and 9 months post-launch over several years. To measure how depreciation is changing, we calculated the average annual change (“run rate”) by comparing depreciation percentages between the earliest and latest available years for each brand. For the 5-month data, Samsung’s range extends through 2025 to include the latest Galaxy S25, providing the freshest insights, while iPhone data covers through 2024. For the 9-month data, Samsung’s 2025 value is modeled due to the recent launch of the Galaxy S25, resulting in a slightly shorter actual data range compared to iPhone’s. These run rates were used to create linear models projecting future depreciation trends. The crossover year is estimated by finding where these projections intersect, indicating when Samsung phones might hold their resale value as well as Apple’s.
Our content is created in good faith and reviewed regularly - if you spot an error, please contact corrections@sellcell.com. Read our Editorial Policy